• Cart
    • Quote
    • Inquiry
    • Cart
    • Quote
    • Inquiry
Novogene
  • Novogene
  • Genomics
    • Human Whole Genome Sequencing
    • Whole Exome Sequencing
    • Plant and Animal Whole Genome Sequencing
    • Microbial Whole Genome Sequencing

    Metagenomics

    • Shotgun Metagenomics Sequencing
    • Amplicon Sequencing

    Transcriptomics

    • mRNA Sequencing
    • Swift & Express mRNA Sequencing New!
    • Full-Length Transcriptome Sequencing
    • Prokaryotic RNA Sequencing
    • Metatranscriptome Sequencing
    • Total RNA Sequencing
    • Small RNA Sequencing (sRNA‑seq)
    • Whole Transcriptome Sequencing

    Single Cell & Spatial Omics

    • 10x Single Cell Gene Expression
    • Illumina PIP-seq Single Cell 3’ RNA Sequencing New!
    • Spatial Transcriptomics Sequencing New!

    Epigenomics

    • Whole Genome Bisulfite Sequencing (WGBS)
    • Enzymatic Methylation Sequencing
    • Directed Methylation Sequencing (DM-Seq) New!
    • RNA Immunoprecipitation Sequencing (RIP-seq)
    • Chromatin Immunoprecipitation Sequencing (ChIP-seq)
    • Cleavage Under Targets & Tagmentation (CUT&Tag) New!
    • Assay for Transposase-Accessible Chromatin with Sequencing (ATAC-seq)
    • Reduced Representation Bisulfite Sequencing (RRBS)

    Proteomics

    • Quantitative Proteomics New!
    • PTM Proteomics New!
    • Olink Proteomics New!

    Metabolomics

    • Untargeted Metabolomics

    Premade Library

    • Sequencing Only on Illumina Sequencer
    • Sequencing Only on Ultima Sequencer
  • PromotionsPromotions
    • Platforms
    • Service & Support
    • Automated Delivery Platform (Falcon)
    • Bioinformatics Analysis Tool (NovoMagic)
    • Customer Service System (CSS)
    • Case Study
    • Blog
    • Webinar
    • Brochure
    • Cancer Research
    • Immuno-oncology
    • Agrigenomics
    • Environment
    • Food Science
    • Human Microbiome
    • Plant and Animal Microbiome
    • Drug Discovery and Development
    • Rare and Complex Diseases
    • About Us
    • Our Locations
    • News & Events
    • Careers
  • Contact UsContact Us
    • mRNA Sequencing
    • Illumina Lane Sequencing
  1. Home
  2. Resources
  3. Blog
  4. Single Cell and Spatial Insights into the Tumor Immune Microenvironment

Single Cell and Spatial Insights into the Tumor Immune Microenvironment

Why do tumors with similar diagnoses respond differently to immunotherapy? Part of the answer lies in the cells surrounding and interacting with the tumor. T cells, B cells, myeloid cells and stromal populations form a complex tumor microenvironment, where differences in cell state and local organization can shape antitumor immunity.

Single-cell sequencing helps researchers resolve this complexity by measuring gene expression in individual cells. Spatial transcriptomics adds tissue context, showing where expression patterns and immune niches occur. Together, these approaches help connect cellular heterogeneity with the mechanisms underlying treatment response and resistance.

Understanding the immune landscape of cancer

A useful tumor immune profile goes beyond identifying the cells present. Researchers also need to understand their functional states, how their proportions vary across samples, and which signaling programs may influence their behavior. Single-cell RNA sequencing can distinguish immune subpopulations and reveal expression patterns associated with activation, cytotoxicity or exhaustion.

Study design determines how these findings can be interpreted. Comparisons between tumor and adjacent tissue can highlight tumor-associated changes, while paired pretreatment and post-treatment samples can help investigate therapy-related shifts. When tissue organization is central to the question, spatial profiling can connect molecular patterns with structures such as tumor boundaries and tertiary lymphoid structures.

Research examples from immune diversity to tissue organization

B cell diversity across cancers

A pan-cancer study in Cell characterized diverse tumor-infiltrating B cell populations and identified subsets associated with prognosis and immunotherapy response. The findings illustrate how single-cell profiling can reveal biologically relevant differences within a broad immune cell category. [1]

Spatial niches for tumor-specific T cells

A Nature study of renal cell carcinoma combined single-cell profiling, TCR analysis and spatial approaches to investigate tumor-specific T cells. The researchers found stem-like T cell features within tertiary lymphoid structures, alongside a distinct macrophage-associated environment at tumor margins. This work shows why immune cell location matters when interpreting function. [2]

Microbiota and immunotherapy response

A study in Signal Transduction and Targeted Therapy used single-cell analysis and experimental validation to investigate microbiota-dependent responses to checkpoint inhibition in mouse tumor models. Changes in T cell states and macrophage populations pointed to cellular mechanisms linking the gut microbiota with antitumor immunity. [3]

Turning sequencing data into biological insight

Novogene’s representative bioinformatics outputs illustrate how single-cell data can support the investigation of tumor immune biology, from an overview of cellular composition to focused analysis of immune function.

Mapping cell populations and immune subsets

Clustering and marker-based annotation establish a cellular map of the sample. UMAP visualizations show the distribution of annotated populations, while marker gene dot plots support cell identity assignments. Further analysis of a population of interest, such as T cells, can resolve finer subtypes and compare their relative representation across study groups.

Characterizing T cell functional states

Expression-based scoring can help characterize functional programs across T cell subsets, including cytotoxicity, proliferation and exhaustion-related states. Heatmaps make these patterns easier to compare and help researchers prioritize populations for further investigation. These scores describe transcriptional features and should be interpreted alongside experimental and biological context.
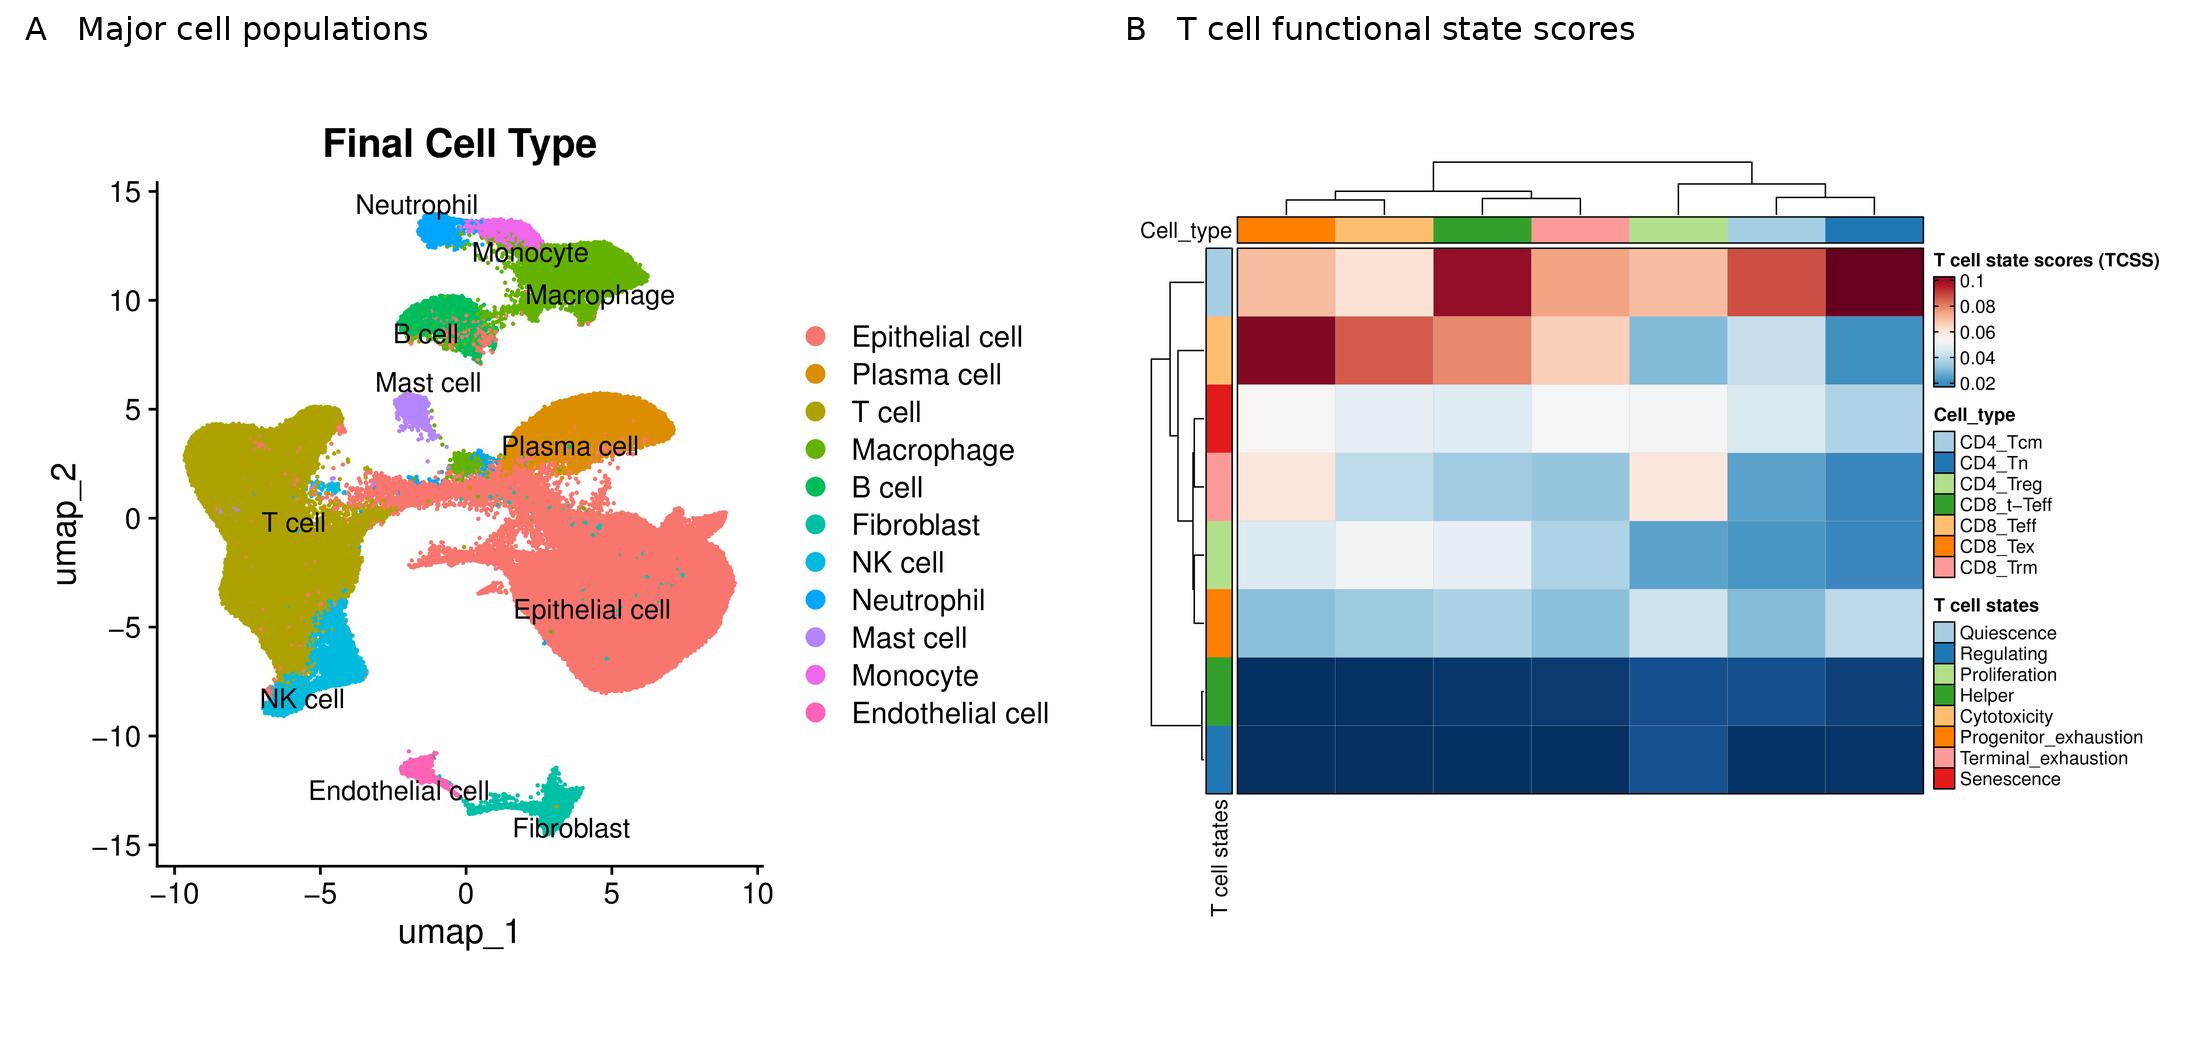
Figure 1. Representative bioinformatics outputs showing major cell populations by UMAP (A) and T cell functional state scores (B). The panels illustrate separate analysis outputs.

Exploring potential cell communication

CellChat analysis uses gene expression and known ligand–receptor relationships to infer potential signaling between cell populations. Network visualizations and ligand–receptor plots can highlight candidate interactions involving immune, stromal and tumor cells. These predictions help generate hypotheses for experimental validation.

Investigating transitions between cell states

Pseudotime analysis can organize cells along inferred expression trajectories to explore relationships among cellular states. Tools such as Monocle2 can reconstruct these trajectories, while CytoTRACE provides complementary information about relative differentiation potential. These analyses suggest possible transitions rather than directly measuring cell lineage or changes over time.
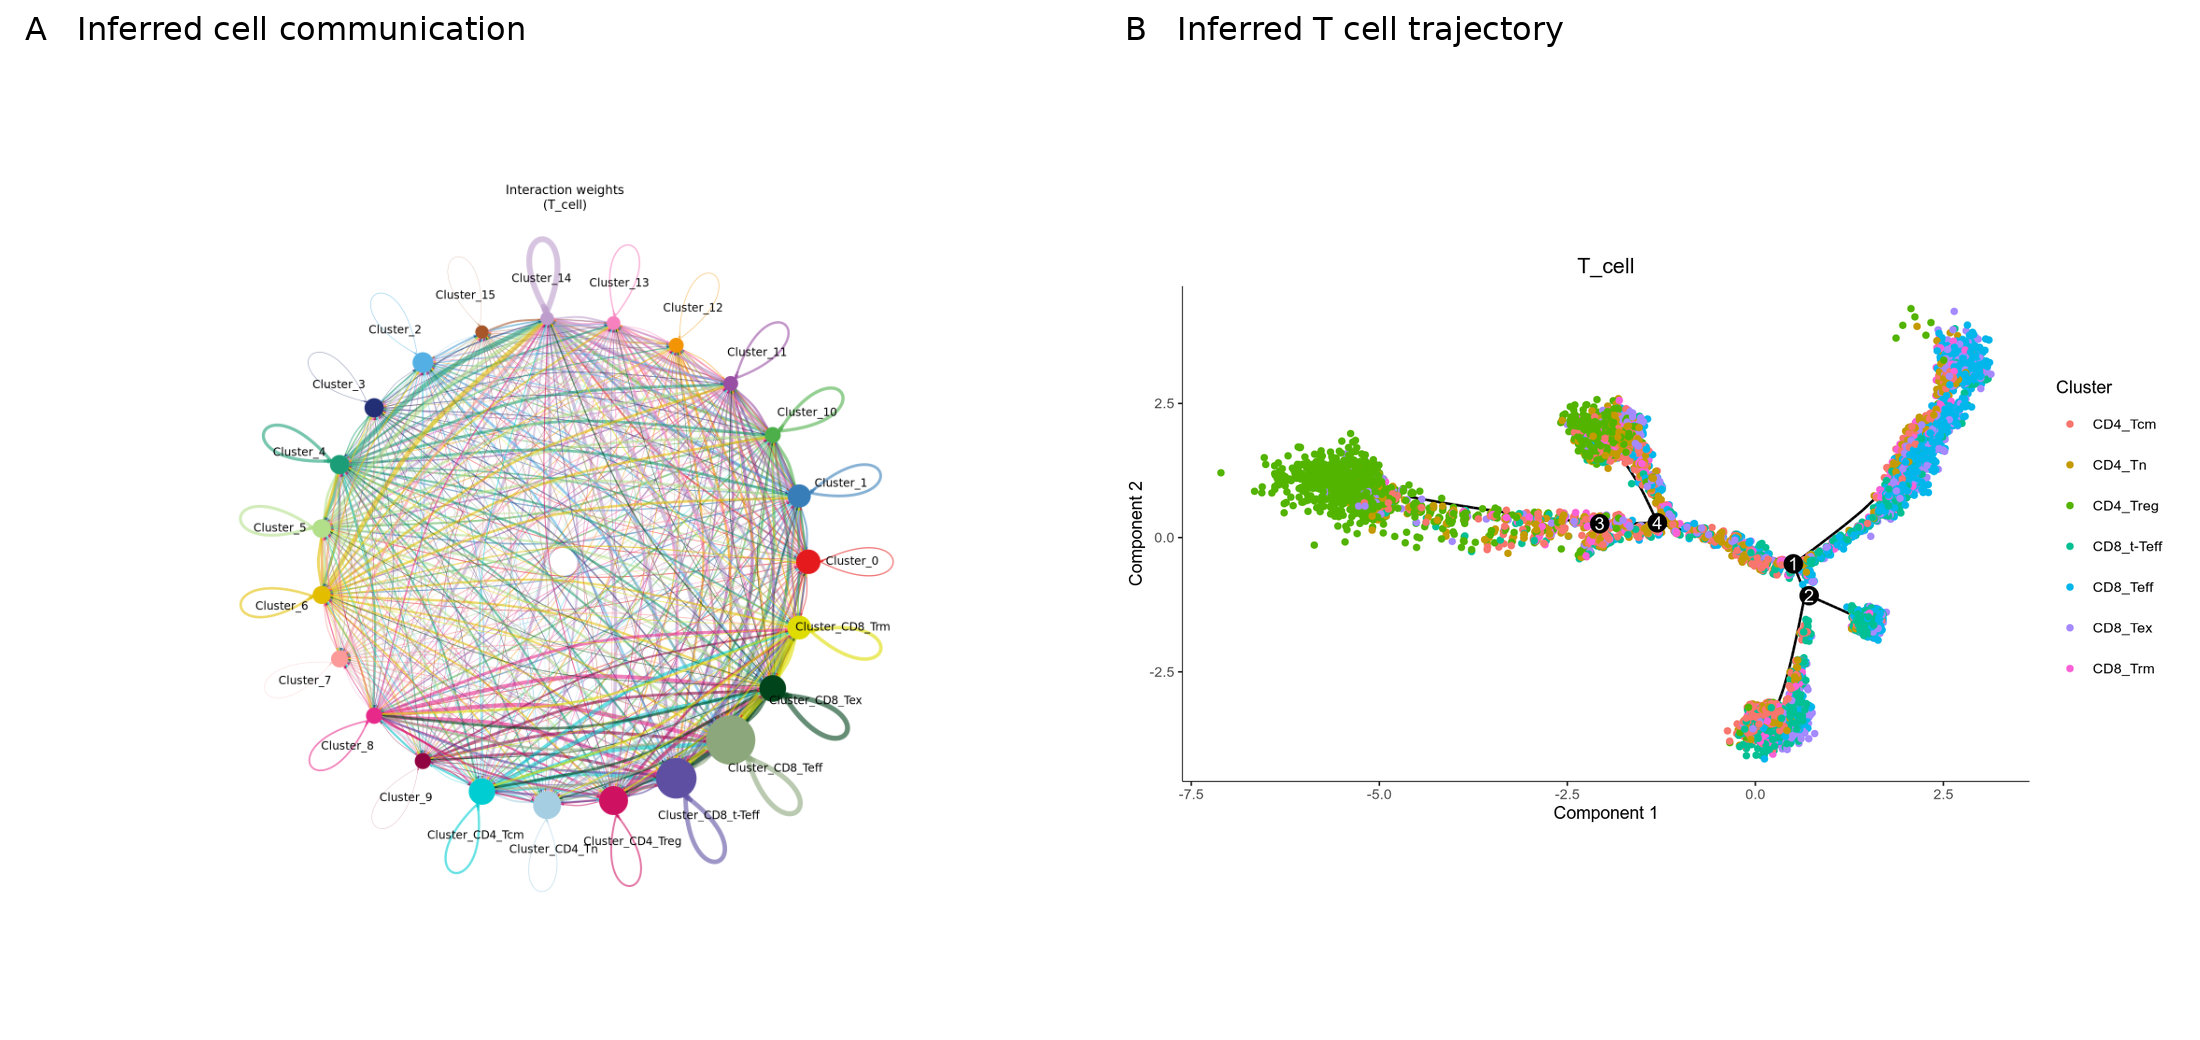
Figure 2. Representative inferred cell communication network (A) and T cell trajectory (B). Both analyses support hypothesis generation and require biological interpretation.

Choosing an approach around the research question

For studies focused on cellular composition and gene expression, 10x Genomics 3′ single-cell RNA sequencing provides a starting point. When the same cells also need TCR or BCR repertoire profiling, a compatible 5′ gene expression and V(D)J workflow can connect receptor clonotypes with transcriptional states. Repertoire sequencing adds information about clonal relationships, while antigen specificity requires additional evidence.

Spatial transcriptomics, including Visium, can complement single-cell data when tissue architecture and immune niches are central to the study. Single-cell ATAC sequencing can add a chromatin accessibility perspective when the question concerns regulatory mechanisms. The appropriate combination depends on the biological objective and available sample material.

Supporting your next immuno oncology study

Novogene supports single-cell and spatial research with workflows spanning sample preparation, library construction, sequencing and bioinformatics analysis. Planning these steps around the scientific question helps researchers obtain interpretable data and identify findings worth pursuing.

Contact Novogene to discuss a single-cell or spatial strategy for your tumor microenvironment or immunotherapy research.

References

1. Yang et al. Pan-cancer single-cell dissection reveals phenotypically distinct B cell subtypes. Cell (2024).

2. Afeyan et al. Tertiary lymphoid structures harbour stem-like tumour-specific T cells. Nature (2026). 3. Single-cell transcriptomic analysis reveals gut microbiota-immunotherapy synergy through modulating tumor microenvironment. Signal Transduction and Targeted Therapy (2025).

ServicesServices menu

CompanyCompany menu

Contact UsContact Us menu

Service SupportService Support menu

Services
mRNA SequencingSwift & Express mRNA SequencingTotal RNA SequencingHuman Whole Genome SequencingWhole Exome Sequencing10x Single Cell Gene ExpressionIllumina PIP-seq Single Cell 3’ RNA SequencingSpatial Transcriptomics SequencingWhole Genome Bisulfite Sequencing (WGBS)Quantitative ProteomicsUntargeted MetabolomicsShotgun Metagenomics SequencingMetatranscriptome SequencingSequencing Only on Illumina SequencerSequencing Only on Ultima SequencerFull-Length Transcriptome SequencingChromatin Immunoprecipitation Sequencing (ChIP-seq)
Company
About UsOur LocationsNews & EventsCareers
Contact Us
Contact Us
Service Support
Automated Delivery Platform (Falcon)Bioinformatics Analysis Tool (NovoMagic)Customer Service System (CSS)
LinkedInLinkedIn hoverYouTubeYouTube hoverXX hoverMetaMeta hoverInstagramInstagram hover
Copyright © 2026 Novogene Corporation Inc. All rights reserved. For Research Use Only.
    • Cart
    • Quote
    • Inquiry
    • Cart
    • Quote
    • Inquiry
Novogene
  • Novogene
  • Genomics
    • Human Whole Genome Sequencing
    • Whole Exome Sequencing
    • Plant and Animal Whole Genome Sequencing
    • Microbial Whole Genome Sequencing

    Metagenomics

    • Shotgun Metagenomics Sequencing
    • Amplicon Sequencing

    Transcriptomics

    • mRNA Sequencing
    • Swift & Express mRNA Sequencing New!
    • Full-Length Transcriptome Sequencing
    • Prokaryotic RNA Sequencing
    • Metatranscriptome Sequencing
    • Total RNA Sequencing
    • Small RNA Sequencing (sRNA‑seq)
    • Whole Transcriptome Sequencing

    Single Cell & Spatial Omics

    • 10x Single Cell Gene Expression
    • Illumina PIP-seq Single Cell 3’ RNA Sequencing New!
    • Spatial Transcriptomics Sequencing New!

    Epigenomics

    • Whole Genome Bisulfite Sequencing (WGBS)
    • Enzymatic Methylation Sequencing
    • Directed Methylation Sequencing (DM-Seq) New!
    • RNA Immunoprecipitation Sequencing (RIP-seq)
    • Chromatin Immunoprecipitation Sequencing (ChIP-seq)
    • Cleavage Under Targets & Tagmentation (CUT&Tag) New!
    • Assay for Transposase-Accessible Chromatin with Sequencing (ATAC-seq)
    • Reduced Representation Bisulfite Sequencing (RRBS)

    Proteomics

    • Quantitative Proteomics New!
    • PTM Proteomics New!
    • Olink Proteomics New!

    Metabolomics

    • Untargeted Metabolomics

    Premade Library

    • Sequencing Only on Illumina Sequencer
    • Sequencing Only on Ultima Sequencer
  • PromotionsPromotions
    • Platforms
    • Service & Support
    • Automated Delivery Platform (Falcon)
    • Bioinformatics Analysis Tool (NovoMagic)
    • Customer Service System (CSS)
    • Case Study
    • Blog
    • Webinar
    • Brochure
    • Cancer Research
    • Immuno-oncology
    • Agrigenomics
    • Environment
    • Food Science
    • Human Microbiome
    • Plant and Animal Microbiome
    • Drug Discovery and Development
    • Rare and Complex Diseases
    • About Us
    • Our Locations
    • News & Events
    • Careers
  • Contact UsContact Us
    • mRNA Sequencing
    • Illumina Lane Sequencing
  1. Home
  2. Resources
  3. Blog
  4. Single Cell and Spatial Insights into the Tumor Immune Microenvironment

Single Cell and Spatial Insights into the Tumor Immune Microenvironment

Why do tumors with similar diagnoses respond differently to immunotherapy? Part of the answer lies in the cells surrounding and interacting with the tumor. T cells, B cells, myeloid cells and stromal populations form a complex tumor microenvironment, where differences in cell state and local organization can shape antitumor immunity.

Single-cell sequencing helps researchers resolve this complexity by measuring gene expression in individual cells. Spatial transcriptomics adds tissue context, showing where expression patterns and immune niches occur. Together, these approaches help connect cellular heterogeneity with the mechanisms underlying treatment response and resistance.

Understanding the immune landscape of cancer

A useful tumor immune profile goes beyond identifying the cells present. Researchers also need to understand their functional states, how their proportions vary across samples, and which signaling programs may influence their behavior. Single-cell RNA sequencing can distinguish immune subpopulations and reveal expression patterns associated with activation, cytotoxicity or exhaustion.

Study design determines how these findings can be interpreted. Comparisons between tumor and adjacent tissue can highlight tumor-associated changes, while paired pretreatment and post-treatment samples can help investigate therapy-related shifts. When tissue organization is central to the question, spatial profiling can connect molecular patterns with structures such as tumor boundaries and tertiary lymphoid structures.

Research examples from immune diversity to tissue organization

B cell diversity across cancers

A pan-cancer study in Cell characterized diverse tumor-infiltrating B cell populations and identified subsets associated with prognosis and immunotherapy response. The findings illustrate how single-cell profiling can reveal biologically relevant differences within a broad immune cell category. [1]

Spatial niches for tumor-specific T cells

A Nature study of renal cell carcinoma combined single-cell profiling, TCR analysis and spatial approaches to investigate tumor-specific T cells. The researchers found stem-like T cell features within tertiary lymphoid structures, alongside a distinct macrophage-associated environment at tumor margins. This work shows why immune cell location matters when interpreting function. [2]

Microbiota and immunotherapy response

A study in Signal Transduction and Targeted Therapy used single-cell analysis and experimental validation to investigate microbiota-dependent responses to checkpoint inhibition in mouse tumor models. Changes in T cell states and macrophage populations pointed to cellular mechanisms linking the gut microbiota with antitumor immunity. [3]

Turning sequencing data into biological insight

Novogene’s representative bioinformatics outputs illustrate how single-cell data can support the investigation of tumor immune biology, from an overview of cellular composition to focused analysis of immune function.

Mapping cell populations and immune subsets

Clustering and marker-based annotation establish a cellular map of the sample. UMAP visualizations show the distribution of annotated populations, while marker gene dot plots support cell identity assignments. Further analysis of a population of interest, such as T cells, can resolve finer subtypes and compare their relative representation across study groups.

Characterizing T cell functional states

Expression-based scoring can help characterize functional programs across T cell subsets, including cytotoxicity, proliferation and exhaustion-related states. Heatmaps make these patterns easier to compare and help researchers prioritize populations for further investigation. These scores describe transcriptional features and should be interpreted alongside experimental and biological context.

Figure 1. Representative bioinformatics outputs showing major cell populations by UMAP (A) and T cell functional state scores (B). The panels illustrate separate analysis outputs.

Exploring potential cell communication

CellChat analysis uses gene expression and known ligand–receptor relationships to infer potential signaling between cell populations. Network visualizations and ligand–receptor plots can highlight candidate interactions involving immune, stromal and tumor cells. These predictions help generate hypotheses for experimental validation.

Investigating transitions between cell states

Pseudotime analysis can organize cells along inferred expression trajectories to explore relationships among cellular states. Tools such as Monocle2 can reconstruct these trajectories, while CytoTRACE provides complementary information about relative differentiation potential. These analyses suggest possible transitions rather than directly measuring cell lineage or changes over time.

Figure 2. Representative inferred cell communication network (A) and T cell trajectory (B). Both analyses support hypothesis generation and require biological interpretation.

Choosing an approach around the research question

For studies focused on cellular composition and gene expression, 10x Genomics 3′ single-cell RNA sequencing provides a starting point. When the same cells also need TCR or BCR repertoire profiling, a compatible 5′ gene expression and V(D)J workflow can connect receptor clonotypes with transcriptional states. Repertoire sequencing adds information about clonal relationships, while antigen specificity requires additional evidence.

Spatial transcriptomics, including Visium, can complement single-cell data when tissue architecture and immune niches are central to the study. Single-cell ATAC sequencing can add a chromatin accessibility perspective when the question concerns regulatory mechanisms. The appropriate combination depends on the biological objective and available sample material.

Supporting your next immuno oncology study

Novogene supports single-cell and spatial research with workflows spanning sample preparation, library construction, sequencing and bioinformatics analysis. Planning these steps around the scientific question helps researchers obtain interpretable data and identify findings worth pursuing.

Contact Novogene to discuss a single-cell or spatial strategy for your tumor microenvironment or immunotherapy research.

References

1. Yang et al. Pan-cancer single-cell dissection reveals phenotypically distinct B cell subtypes. Cell (2024).

2. Afeyan et al. Tertiary lymphoid structures harbour stem-like tumour-specific T cells. Nature (2026). 3. Single-cell transcriptomic analysis reveals gut microbiota-immunotherapy synergy through modulating tumor microenvironment. Signal Transduction and Targeted Therapy (2025).

ServicesServices menu

CompanyCompany menu

Contact UsContact Us menu

Service SupportService Support menu

Services
mRNA SequencingSwift & Express mRNA SequencingTotal RNA SequencingHuman Whole Genome SequencingWhole Exome Sequencing10x Single Cell Gene ExpressionIllumina PIP-seq Single Cell 3’ RNA SequencingSpatial Transcriptomics SequencingWhole Genome Bisulfite Sequencing (WGBS)Quantitative ProteomicsUntargeted MetabolomicsShotgun Metagenomics SequencingMetatranscriptome SequencingSequencing Only on Illumina SequencerSequencing Only on Ultima SequencerFull-Length Transcriptome SequencingChromatin Immunoprecipitation Sequencing (ChIP-seq)
Company
About UsOur LocationsNews & EventsCareers
Contact Us
Contact Us
Service Support
Automated Delivery Platform (Falcon)Bioinformatics Analysis Tool (NovoMagic)Customer Service System (CSS)
LinkedInLinkedIn hoverYouTubeYouTube hoverXX hoverMetaMeta hoverInstagramInstagram hover
Copyright © 2026 Novogene Corporation Inc. All rights reserved. For Research Use Only.
Your Privacy ChoicesPrivacy PolicyCookie PolicyCareers