
• Cart
    • Quote
    • Inquiry
    • Cart
    • Quote
    • Inquiry
Novogene
  • Novogene
  • Genomics
    • Human Whole Genome Sequencing
    • Whole Exome Sequencing
    • Plant and Animal Whole Genome Sequencing
    • Plant and Animal De Novo Sequencing
    • Microbial Whole Genome Sequencing
    • Microbial De Novo Sequencing

    Metagenomics

    • Shotgun Metagenomics Sequencing
    • Amplicon Sequencing

    Transcriptomics

    • mRNA Sequencing
    • Swift & Express mRNA Sequencing New!
    • Full-Length Transcriptome Sequencing
    • Prokaryotic RNA Sequencing
    • Metatranscriptome Sequencing
    • Total RNA Sequencing
    • Small RNA Sequencing (sRNA‑seq)
    • Whole Transcriptome Sequencing

    Single Cell & Spatial Omics

    • 10x Single Cell Gene Expression
    • Illumina PIP-seq Single Cell 3’ RNA Sequencing New!
    • Spatial Transcriptomics Sequencing New!

    Epigenomics

    • Whole Genome Bisulfite Sequencing (WGBS)
    • Enzymatic Methylation Sequencing
    • Directed Methylation Sequencing (DM-Seq) New!
    • RNA Immunoprecipitation Sequencing (RIP-seq)
    • Chromatin Immunoprecipitation Sequencing (ChIP-seq)
    • Cleavage Under Targets & Tagmentation (CUT&Tag) New!
    • Assay for Transposase-Accessible Chromatin with Sequencing (ATAC-seq)
    • Reduced Representation Bisulfite Sequencing (RRBS)

    Proteomics

    • Quantitative Proteomics New!
    • PTM Proteomics New!
    • Olink Proteomics New!

    Metabolomics

    • Untargeted Metabolomics

    Premade Library

    • Sequencing Only on Illumina Sequencer
    • Sequencing Only on Ultima Sequencer
  • PromotionsPromotions
    • Platforms
    • Service & Support
    • Automated Delivery Platform (Falcon)
    • Bioinformatics Analysis Tool (NovoMagic)
    • Customer Service System (CSS)
    • Case Study
    • Blog
    • Webinar
    • Brochure
    • Cancer Research
    • Immuno-oncology
    • Agrigenomics
    • Environment
    • Food Science
    • Human Microbiome
    • Plant and Animal Microbiome
    • Drug Discovery and Development
    • Rare and Complex Diseases
    • About Us
    • Our Locations
    • News & Events
    • Careers
  • Contact UsContact Us
    • mRNA Sequencing
    • Illumina Lane Sequencing

ServicesServices menu

CompanyCompany menu

Contact UsContact Us menu

Service SupportService Support menu

Services
mRNA SequencingSwift & Express mRNA SequencingTotal RNA SequencingHuman Whole Genome SequencingWhole Exome Sequencing10x Single Cell Gene ExpressionIllumina PIP-seq Single Cell 3’ RNA SequencingSpatial Transcriptomics SequencingWhole Genome Bisulfite Sequencing (WGBS)Quantitative ProteomicsUntargeted MetabolomicsShotgun Metagenomics SequencingMetatranscriptome SequencingSequencing Only on Illumina SequencerSequencing Only on Ultima SequencerFull-Length Transcriptome SequencingChromatin Immunoprecipitation Sequencing (ChIP-seq)
Company
About UsOur LocationsNews & EventsCareers
Contact Us
Contact Us
Service Support
Automated Delivery Platform (Falcon)Bioinformatics Analysis Tool (NovoMagic)Customer Service System (CSS)
LinkedInLinkedIn hoverYouTubeYouTube hoverXX hoverMetaMeta hoverInstagramInstagram hover
Copyright © 2026 Novogene Corporation Inc. All rights reserved. For Research Use Only.
    • Cart
    • Quote
    • Inquiry
    • Cart
    • Quote
    • Inquiry
Novogene
  • Novogene
  • Genomics
    • Human Whole Genome Sequencing
    • Whole Exome Sequencing
    • Plant and Animal Whole Genome Sequencing
    • Plant and Animal De Novo Sequencing
    • Microbial Whole Genome Sequencing
    • Microbial De Novo Sequencing

    Metagenomics

    • Shotgun Metagenomics Sequencing
    • Amplicon Sequencing

    Transcriptomics

    • mRNA Sequencing
    • Swift & Express mRNA Sequencing New!
    • Full-Length Transcriptome Sequencing
    • Prokaryotic RNA Sequencing
    • Metatranscriptome Sequencing
    • Total RNA Sequencing
    • Small RNA Sequencing (sRNA‑seq)
    • Whole Transcriptome Sequencing

    Single Cell & Spatial Omics

    • 10x Single Cell Gene Expression
    • Illumina PIP-seq Single Cell 3’ RNA Sequencing New!
    • Spatial Transcriptomics Sequencing New!

    Epigenomics

    • Whole Genome Bisulfite Sequencing (WGBS)
    • Enzymatic Methylation Sequencing
    • Directed Methylation Sequencing (DM-Seq) New!
    • RNA Immunoprecipitation Sequencing (RIP-seq)
    • Chromatin Immunoprecipitation Sequencing (ChIP-seq)
    • Cleavage Under Targets & Tagmentation (CUT&Tag) New!
    • Assay for Transposase-Accessible Chromatin with Sequencing (ATAC-seq)
    • Reduced Representation Bisulfite Sequencing (RRBS)

    Proteomics

    • Quantitative Proteomics New!
    • PTM Proteomics New!
    • Olink Proteomics New!

    Metabolomics

    • Untargeted Metabolomics

    Premade Library

    • Sequencing Only on Illumina Sequencer
    • Sequencing Only on Ultima Sequencer
  • PromotionsPromotions
    • Platforms
    • Service & Support
    • Automated Delivery Platform (Falcon)
    • Bioinformatics Analysis Tool (NovoMagic)
    • Customer Service System (CSS)
    • Case Study
    • Blog
    • Webinar
    • Brochure
    • Cancer Research
    • Immuno-oncology
    • Agrigenomics
    • Environment
    • Food Science
    • Human Microbiome
    • Plant and Animal Microbiome
    • Drug Discovery and Development
    • Rare and Complex Diseases
    • About Us
    • Our Locations
    • News & Events
    • Careers
  • Contact UsContact Us
    • mRNA Sequencing
    • Illumina Lane Sequencing

ServicesServices menu

CompanyCompany menu

Contact UsContact Us menu

Service SupportService Support menu

Services
mRNA SequencingSwift & Express mRNA SequencingTotal RNA SequencingHuman Whole Genome SequencingWhole Exome Sequencing10x Single Cell Gene ExpressionIllumina PIP-seq Single Cell 3’ RNA SequencingSpatial Transcriptomics SequencingWhole Genome Bisulfite Sequencing (WGBS)Quantitative ProteomicsUntargeted MetabolomicsShotgun Metagenomics SequencingMetatranscriptome SequencingSequencing Only on Illumina SequencerSequencing Only on Ultima SequencerFull-Length Transcriptome SequencingChromatin Immunoprecipitation Sequencing (ChIP-seq)
Company
About UsOur LocationsNews & EventsCareers
Contact Us
Contact Us
Service Support
Automated Delivery Platform (Falcon)Bioinformatics Analysis Tool (NovoMagic)Customer Service System (CSS)
LinkedInLinkedIn hoverYouTubeYouTube hoverXX hoverMetaMeta hoverInstagramInstagram hover
Copyright © 2026 Novogene Corporation Inc. All rights reserved. For Research Use Only.
banner laptop bg
banner mobile bg

Human Whole Genome Sequencing

OverviewOverview
BenefitsBenefits
ApplicationsApplications
SpecificationsSpecifications
ResourcesResources

Human whole genome sequencing (hWGS) provides a broad, unbiased view of the human genome for both germline and somatic variant discovery. A single assay detects SNPs, InDels, structural variants (SVs) and copy number variants (CNVs) across coding and non coding regions, offering comprehensive resolution for studies in rare and inherited diseases, cancer genomics, population genetics, pharmacogenomics, and the development or validation of new analytical methods.


Novogene supports projects of all scales, from individual samples to large cohort programs, using robust QC checkpoints, validated workflows, and flexible sequencing strategies. Researchers can choose between short read and long read approaches on leading platforms including Illumina NovaSeq X Plus, Oxford Nanopore PromethION, and PacBio Revio. This multi technology framework enables tailored study designs that improve SV detection, clarify variant interpretation in highly repetitive or polymorphic regions, and streamline high throughput sequencing needs.

Deliverables may include FASTQ, BAM/CRAM, VCF, and clear analysis summaries with publication ready outputs. Optional bioinformatics support extends from standard pipelines to more advanced interpretation, helping teams transition efficiently from raw data to meaningful, actionable insights.


Benefits of Novogene Human Whole Genome Sequencing (hWGS)

High Quality Data Delivery High Quality Data Delivery
High Quality Data Delivery

Robust QC checkpoints and transparent delivery metrics ensure accurate, reliable data aligned with project requirements.

High Quality Data Delivery

Robust QC checkpoints and transparent delivery metrics ensure accurate, reliable data aligned with project requirements.

Flexible Short Read and Long Read Sequencing Flexible Short Read and Long Read Sequencing
Flexible Short Read and Long Read Sequencing

Choose short read or long read options on leading platforms, enabling optimized detection even in complex or repetitive regions.

Flexible Short Read and Long Read Sequencing

Choose short read or long read options on leading platforms, enabling optimized detection even in complex or repetitive regions.

Excellent Variant Detection Excellent Variant Detection
Excellent Variant Detection

High depth, uniform coverage delivers strong performance for heterozygous variants.

Excellent Variant Detection

High depth, uniform coverage delivers strong performance for heterozygous variants.

Comprehensive Bioinformatics and Expert Interpretation Comprehensive Bioinformatics and Expert Interpretation
Comprehensive Bioinformatics and Expert Interpretation

End to end outputs paired with optional advanced bioinformatics analysis and publication ready figures.

Comprehensive Bioinformatics and Expert Interpretation

End to end outputs paired with optional advanced bioinformatics analysis and publication ready figures.

Scalable Project SupportScalable Project Support
Scalable Project Support

Standardized coordination and documentation streamline both pilot scale and cohort scale hWGS projects.

Scalable Project Support

Standardized coordination and documentation streamline both pilot scale and cohort scale hWGS projects.

Benefits of Novogene Human Whole Genome Sequencing (hWGS)

High Quality Data Delivery High Quality Data Delivery
High Quality Data Delivery

Robust QC checkpoints and transparent delivery metrics ensure accurate, reliable data aligned with project requirements.

High Quality Data Delivery

Robust QC checkpoints and transparent delivery metrics ensure accurate, reliable data aligned with project requirements.

Flexible Short Read and Long Read Sequencing Flexible Short Read and Long Read Sequencing
Flexible Short Read and Long Read Sequencing

Choose short read or long read options on leading platforms, enabling optimized detection even in complex or repetitive regions.

Flexible Short Read and Long Read Sequencing

Choose short read or long read options on leading platforms, enabling optimized detection even in complex or repetitive regions.

Excellent Variant Detection Excellent Variant Detection
Excellent Variant Detection

High depth, uniform coverage delivers strong performance for heterozygous variants.

Excellent Variant Detection

High depth, uniform coverage delivers strong performance for heterozygous variants.

Comprehensive Bioinformatics and Expert Interpretation Comprehensive Bioinformatics and Expert Interpretation
Comprehensive Bioinformatics and Expert Interpretation

End to end outputs paired with optional advanced bioinformatics analysis and publication ready figures.

Comprehensive Bioinformatics and Expert Interpretation

End to end outputs paired with optional advanced bioinformatics analysis and publication ready figures.

Scalable Project SupportScalable Project Support
Scalable Project Support

Standardized coordination and documentation streamline both pilot scale and cohort scale hWGS projects.

Scalable Project Support

Standardized coordination and documentation streamline both pilot scale and cohort scale hWGS projects.

Applications of Human Whole Genome Sequencing

Human whole genome sequencing (hWGS) supports a wide range of research needs, providing genome wide visibility into genetic diseases, cancer biology, pathogenesis mechanisms, and human population history.

Identifying Novel Disease Genes

Sequencing individuals with similar unexplained syndromes helps researchers pinpoint shared pathogenic variants, enabling discovery of new rare disease genes and expanding understanding of inherited disorders.

Identifying Novel Disease Genes

Sequencing individuals with similar unexplained syndromes helps researchers pinpoint shared pathogenic variants, enabling discovery of new rare disease genes and expanding understanding of inherited disorders.

Detecting Cancer Driver Mutations

hWGS can identify driver mutations that promote tumor growth, distinguishing causative changes from background variants and uncovering novel pathways in cancer genomics.

Detecting Cancer Driver Mutations

hWGS can identify driver mutations that promote tumor growth, distinguishing causative changes from background variants and uncovering novel pathways in cancer genomics.

Understanding Virulence and Antibiotic Resistance

By comparing genomes across strains, WGS reveals genetic determinants of virulence, antibiotic resistance, and host adaptation—providing insight into the molecular basis of pathogenesis.

Understanding Virulence and Antibiotic Resistance

By comparing genomes across strains, WGS reveals genetic determinants of virulence, antibiotic resistance, and host adaptation—providing insight into the molecular basis of pathogenesis.

Tracing Human Population Origins and Migration

Genome wide variant comparisons help reconstruct population genetics, ancestry, admixture, and ancient migration routes, enabling deeper study of human evolutionary history.

Tracing Human Population Origins and Migration

Genome wide variant comparisons help reconstruct population genetics, ancestry, admixture, and ancient migration routes, enabling deeper study of human evolutionary history.

Applications of Human Whole Genome Sequencing

Human whole genome sequencing (hWGS) supports a wide range of research needs, providing genome wide visibility into genetic diseases, cancer biology, pathogenesis mechanisms, and human population history.

Identifying Novel Disease Genes

Sequencing individuals with similar unexplained syndromes helps researchers pinpoint shared pathogenic variants, enabling discovery of new rare disease genes and expanding understanding of inherited disorders.

Identifying Novel Disease Genes

Sequencing individuals with similar unexplained syndromes helps researchers pinpoint shared pathogenic variants, enabling discovery of new rare disease genes and expanding understanding of inherited disorders.

Detecting Cancer Driver Mutations

hWGS can identify driver mutations that promote tumor growth, distinguishing causative changes from background variants and uncovering novel pathways in cancer genomics.

Detecting Cancer Driver Mutations

hWGS can identify driver mutations that promote tumor growth, distinguishing causative changes from background variants and uncovering novel pathways in cancer genomics.

Understanding Virulence and Antibiotic Resistance

By comparing genomes across strains, WGS reveals genetic determinants of virulence, antibiotic resistance, and host adaptation—providing insight into the molecular basis of pathogenesis.

Understanding Virulence and Antibiotic Resistance

By comparing genomes across strains, WGS reveals genetic determinants of virulence, antibiotic resistance, and host adaptation—providing insight into the molecular basis of pathogenesis.

Tracing Human Population Origins and Migration

Genome wide variant comparisons help reconstruct population genetics, ancestry, admixture, and ancient migration routes, enabling deeper study of human evolutionary history.

Tracing Human Population Origins and Migration

Genome wide variant comparisons help reconstruct population genetics, ancestry, admixture, and ancient migration routes, enabling deeper study of human evolutionary history.

Specifications

Sample Requirements

Sample amounts are listed for reference only. Download the Sample Submission Guidelines to learn more. For detailed information, please contact us with your customized requests.


*NC/QC: NanoDrop concentration/Qubit concentration

Platform TypeSample TypeAmount (Qubit®)Purity
Illumina NovaSeq X PlusGenomic DNA≥ 100 ngA260/280=1.8-2.0;
no degradation,
no contamination
Genomic DNA
(PCR free)
≥ 1 μg
Genomic DNA
from FFPE tissue
≥ 300 ngFragments should be ≥ 1500 bp
PacBio Revio DNA HiFi libraryHMW Genomic DNA≥ 3 μgA260/280=1.75-2.0;
A260/230=1.5-2.6;
*NC/QC=1.0-2.2;
Fragments should be ≥ 30 kb
PacBio PCR product libraryPCR product≥ 2 μgOD260/280=1.75~2.0;
OD260/230=1.4~2.6;
*NC/QC=0.95~3.00; Single band
(PacBio library fragments
distributed above 1k)
Nanopore PromethION DNA libraryHMW Genomic DNA≥ 8 μgA260/280=1.75-2.0;
A260/230=1.4-2.6;
*NC/QC=0.95~3.00;
Fragments should be ≥ 30 kb
Nanopore Ultra-long DNA LibraryuHMW Genomic DNA (blood and cells)≥ 30 μgOD260/280=1.7-2.0;
OD260/230=1.3-2.6;
*NC/QC=0.95-3.00;
Fragments should be ≥ 300K, no fragments
below 30k.
Nanopore PCR product libraryPCR product≥ 2 μgOD260/280=1.75~2.0;
OD260/230=1.4~2.6;
*NC/QC=0.95~3.00;
Single band

Sample Requirements

Sample amounts are listed for reference only. Download the Sample Submission Guidelines to learn more. For detailed information, please contact us with your customized requests.


*NC/QC: NanoDrop concentration/Qubit concentration

Platform TypeSample TypeAmount (Qubit®)Purity
Illumina NovaSeq X PlusGenomic DNA≥ 100 ngA260/280=1.8-2.0;
no degradation,
no contamination
Genomic DNA
(PCR free)
≥ 1 μg
Genomic DNA
from FFPE tissue
≥ 300 ngFragments should be ≥ 1500 bp
PacBio Revio DNA HiFi libraryHMW Genomic DNA≥ 3 μgA260/280=1.75-2.0;
A260/230=1.5-2.6;
*NC/QC=1.0-2.2;
Fragments should be ≥ 30 kb
PacBio PCR product libraryPCR product≥ 2 μgOD260/280=1.75~2.0;
OD260/230=1.4~2.6;
*NC/QC=0.95~3.00; Single band
(PacBio library fragments
distributed above 1k)
Nanopore PromethION DNA libraryHMW Genomic DNA≥ 8 μgA260/280=1.75-2.0;
A260/230=1.4-2.6;
*NC/QC=0.95~3.00;
Fragments should be ≥ 30 kb
Nanopore Ultra-long DNA LibraryuHMW Genomic DNA (blood and cells)≥ 30 μgOD260/280=1.7-2.0;
OD260/230=1.3-2.6;
*NC/QC=0.95-3.00;
Fragments should be ≥ 300K, no fragments
below 30k.
Nanopore PCR product libraryPCR product≥ 2 μgOD260/280=1.75~2.0;
OD260/230=1.4~2.6;
*NC/QC=0.95~3.00;
Single band

Sample Requirements

Sample amounts are listed for reference only. Download the Sample Submission Guidelines to learn more. For detailed information, please contact us with your customized requests.


*NC/QC: NanoDrop concentration/Qubit concentration

Platform TypeSample TypeAmount (Qubit®)Purity
Illumina NovaSeq X PlusGenomic DNA≥ 100 ngA260/280=1.8-2.0;
no degradation,
no contamination
Genomic DNA
(PCR free)
≥ 1 μg
Genomic DNA
from FFPE tissue
≥ 300 ngFragments should be ≥ 1500 bp
PacBio Revio DNA HiFi libraryHMW Genomic DNA≥ 3 μgA260/280=1.75-2.0;
A260/230=1.5-2.6;
*NC/QC=1.0-2.2;
Fragments should be ≥ 30 kb
PacBio PCR product libraryPCR product≥ 2 μgOD260/280=1.75~2.0;
OD260/230=1.4~2.6;
*NC/QC=0.95~3.00; Single band
(PacBio library fragments
distributed above 1k)
Nanopore PromethION DNA libraryHMW Genomic DNA≥ 8 μgA260/280=1.75-2.0;
A260/230=1.4-2.6;
*NC/QC=0.95~3.00;
Fragments should be ≥ 30 kb
Nanopore Ultra-long DNA LibraryuHMW Genomic DNA (blood and cells)≥ 30 μgOD260/280=1.7-2.0;
OD260/230=1.3-2.6;
*NC/QC=0.95-3.00;
Fragments should be ≥ 300K, no fragments
below 30k.
Nanopore PCR product libraryPCR product≥ 2 μgOD260/280=1.75~2.0;
OD260/230=1.4~2.6;
*NC/QC=0.95~3.00;
Single band

Sample Requirements

Sample amounts are listed for reference only. Download the Sample Submission Guidelines to learn more. For detailed information, please contact us with your customized requests.


*NC/QC: NanoDrop concentration/Qubit concentration

Platform TypeSample TypeAmount (Qubit®)Purity
Illumina NovaSeq X PlusGenomic DNA≥ 100 ngA260/280=1.8-2.0;
no degradation,
no contamination
Genomic DNA
(PCR free)
≥ 1 μg
Genomic DNA
from FFPE tissue
≥ 300 ngFragments should be ≥ 1500 bp
PacBio Revio DNA HiFi libraryHMW Genomic DNA≥ 3 μgA260/280=1.75-2.0;
A260/230=1.5-2.6;
*NC/QC=1.0-2.2;
Fragments should be ≥ 30 kb
PacBio PCR product libraryPCR product≥ 2 μgOD260/280=1.75~2.0;
OD260/230=1.4~2.6;
*NC/QC=0.95~3.00; Single band
(PacBio library fragments
distributed above 1k)
Nanopore PromethION DNA libraryHMW Genomic DNA≥ 8 μgA260/280=1.75-2.0;
A260/230=1.4-2.6;
*NC/QC=0.95~3.00;
Fragments should be ≥ 30 kb
Nanopore Ultra-long DNA LibraryuHMW Genomic DNA (blood and cells)≥ 30 μgOD260/280=1.7-2.0;
OD260/230=1.3-2.6;
*NC/QC=0.95-3.00;
Fragments should be ≥ 300K, no fragments
below 30k.
Nanopore PCR product libraryPCR product≥ 2 μgOD260/280=1.75~2.0;
OD260/230=1.4~2.6;
*NC/QC=0.95~3.00;
Single band

Sequencing and Analysis

Recommended data outputs and analysis contents displayed are for reference only. For detailed information, please contact us with your customized requests.

Platform TypeIllumina NovaSeq X Plus /NovaSeq6000PacBio RevioNanopore PromethION
Read LengthPaired-end 150 bpAverage > 15 kbAverage > 20 kb
Sequencing DepthRare diseases: 30–50×
Tumor tissues: 50×
Adjacent normal tissues & blood: 30×
Genetic diseases: 10–20×
Tumor tissues: ≥20×
Data qualityGuaranteed ≥ 85% bases with Q30 or higherCondition based
Standard AnalysisData quality control (QC)
Alignment to the reference genome
SNP/InDel/SV/CNV detection
Somatic SNP/InDel/SV/CNV detection for tumor‑normal paired samples
Data quality control (QC)
Sequence alignment
Structural variant (SV) detection
Variant annotation
Advanced AnalysisDisease Advanced Analysis

IBD / Kinship analysis
Variant filtering & ACMG classification
Candidate CNV/SV filtering
Dominant/recessive inheritance modeling
Linkage analysis; ROH detection
Shared‑gene / candidate‑gene screening
Pathway enrichment; gene–disease association
Protein interaction network
HLA typing

Cancer Advanced Analysis

Predisposing gene screening
Mutational spectrum & mutational signatures
Known & novel driver gene identification
SMG & pathway analysis
Somatic Circos visualization
TMB analysis
Driver CNV (GISTIC) & non‑coding driver mutation detection
Tumor purity & ploidy
Intra‑tumor heterogeneity
Fusion gene detection
LOH analysis
HLA typing (tumor/normal)

Personalized / Optional Add‑Ons

CRISPR/Cas9 off‑target analysis
Xenograft (PDX) tumor analysis
Integration site detection
Somatic SNV/INDEL for single tumor
Neoantigen prediction
Tumor evolution (≥3 tumor samples)
gVCF file generation
-

Sequencing and Analysis

Recommended data outputs and analysis contents displayed are for reference only. For detailed information, please contact us with your customized requests.

Platform TypeIllumina NovaSeq X Plus /NovaSeq6000PacBio RevioNanopore PromethION
Read LengthPaired-end 150 bpAverage > 15 kbAverage > 20 kb
Sequencing DepthRare diseases: 30–50×
Tumor tissues: 50×
Adjacent normal tissues & blood: 30×
Genetic diseases: 10–20×
Tumor tissues: ≥20×
Data qualityGuaranteed ≥ 85% bases with Q30 or higherCondition based
Standard AnalysisData quality control (QC)
Alignment to the reference genome
SNP/InDel/SV/CNV detection
Somatic SNP/InDel/SV/CNV detection for tumor‑normal paired samples
Data quality control (QC)
Sequence alignment
Structural variant (SV) detection
Variant annotation
Advanced AnalysisDisease Advanced Analysis

IBD / Kinship analysis
Variant filtering & ACMG classification
Candidate CNV/SV filtering
Dominant/recessive inheritance modeling
Linkage analysis; ROH detection
Shared‑gene / candidate‑gene screening
Pathway enrichment; gene–disease association
Protein interaction network
HLA typing

Cancer Advanced Analysis

Predisposing gene screening
Mutational spectrum & mutational signatures
Known & novel driver gene identification
SMG & pathway analysis
Somatic Circos visualization
TMB analysis
Driver CNV (GISTIC) & non‑coding driver mutation detection
Tumor purity & ploidy
Intra‑tumor heterogeneity
Fusion gene detection
LOH analysis
HLA typing (tumor/normal)

Personalized / Optional Add‑Ons

CRISPR/Cas9 off‑target analysis
Xenograft (PDX) tumor analysis
Integration site detection
Somatic SNV/INDEL for single tumor
Neoantigen prediction
Tumor evolution (≥3 tumor samples)
gVCF file generation
-

Sequencing and Analysis

Recommended data outputs and analysis contents displayed are for reference only. For detailed information, please contact us with your customized requests.

Platform TypeIllumina NovaSeq X Plus /NovaSeq6000PacBio RevioNanopore PromethION
Read LengthPaired-end 150 bpAverage > 15 kbAverage > 20 kb
Sequencing DepthRare diseases: 30–50×
Tumor tissues: 50×
Adjacent normal tissues & blood: 30×
Genetic diseases: 10–20×
Tumor tissues: ≥20×
Data qualityGuaranteed ≥ 85% bases with Q30 or higherCondition based
Standard AnalysisData quality control (QC)
Alignment to the reference genome
SNP/InDel/SV/CNV detection
Somatic SNP/InDel/SV/CNV detection for tumor‑normal paired samples
Data quality control (QC)
Sequence alignment
Structural variant (SV) detection
Variant annotation
Advanced AnalysisDisease Advanced Analysis

IBD / Kinship analysis
Variant filtering & ACMG classification
Candidate CNV/SV filtering
Dominant/recessive inheritance modeling
Linkage analysis; ROH detection
Shared‑gene / candidate‑gene screening
Pathway enrichment; gene–disease association
Protein interaction network
HLA typing

Cancer Advanced Analysis

Predisposing gene screening
Mutational spectrum & mutational signatures
Known & novel driver gene identification
SMG & pathway analysis
Somatic Circos visualization
TMB analysis
Driver CNV (GISTIC) & non‑coding driver mutation detection
Tumor purity & ploidy
Intra‑tumor heterogeneity
Fusion gene detection
LOH analysis
HLA typing (tumor/normal)

Personalized / Optional Add‑Ons

CRISPR/Cas9 off‑target analysis
Xenograft (PDX) tumor analysis
Integration site detection
Somatic SNV/INDEL for single tumor
Neoantigen prediction
Tumor evolution (≥3 tumor samples)
gVCF file generation
-

Sequencing and Analysis

Recommended data outputs and analysis contents displayed are for reference only. For detailed information, please contact us with your customized requests.

Platform TypeIllumina NovaSeq X Plus /NovaSeq6000PacBio RevioNanopore PromethION
Read LengthPaired-end 150 bpAverage > 15 kbAverage > 20 kb
Sequencing DepthRare diseases: 30–50×
Tumor tissues: 50×
Adjacent normal tissues & blood: 30×
Genetic diseases: 10–20×
Tumor tissues: ≥20×
Data qualityGuaranteed ≥ 85% bases with Q30 or higherCondition based
Standard AnalysisData quality control (QC)
Alignment to the reference genome
SNP/InDel/SV/CNV detection
Somatic SNP/InDel/SV/CNV detection for tumor‑normal paired samples
Data quality control (QC)
Sequence alignment
Structural variant (SV) detection
Variant annotation
Advanced AnalysisDisease Advanced Analysis

IBD / Kinship analysis
Variant filtering & ACMG classification
Candidate CNV/SV filtering
Dominant/recessive inheritance modeling
Linkage analysis; ROH detection
Shared‑gene / candidate‑gene screening
Pathway enrichment; gene–disease association
Protein interaction network
HLA typing

Cancer Advanced Analysis

Predisposing gene screening
Mutational spectrum & mutational signatures
Known & novel driver gene identification
SMG & pathway analysis
Somatic Circos visualization
TMB analysis
Driver CNV (GISTIC) & non‑coding driver mutation detection
Tumor purity & ploidy
Intra‑tumor heterogeneity
Fusion gene detection
LOH analysis
HLA typing (tumor/normal)

Personalized / Optional Add‑Ons

CRISPR/Cas9 off‑target analysis
Xenograft (PDX) tumor analysis
Integration site detection
Somatic SNV/INDEL for single tumor
Neoantigen prediction
Tumor evolution (≥3 tumor samples)
gVCF file generation
-

Project Workflow

From sample preparation and library construction through sequencing, data quality control, and bioinformatics analysis, Novogene delivers a streamlined hWGS workflow supported by defined QC checkpoints and standardized procedures to ensure reliable results.

Project Workflow

Project Workflow

From sample preparation and library construction through sequencing, data quality control, and bioinformatics analysis, Novogene delivers a streamlined hWGS workflow supported by defined QC checkpoints and standardized procedures to ensure reliable results.

Project Workflow

Project Workflow

From sample preparation and library construction through sequencing, data quality control, and bioinformatics analysis, Novogene delivers a streamlined hWGS workflow supported by defined QC checkpoints and standardized procedures to ensure reliable results.

Project Workflow

Project Workflow

From sample preparation and library construction through sequencing, data quality control, and bioinformatics analysis, Novogene delivers a streamlined hWGS workflow supported by defined QC checkpoints and standardized procedures to ensure reliable results.

Project Workflow

Specifications

Sample Requirements

Sample amounts are listed for reference only. Download the Sample Submission Guidelines to learn more. For detailed information, please contact us with your customized requests.


*NC/QC: NanoDrop concentration/Qubit concentration

Platform TypeSample TypeAmount (Qubit®)Purity
Illumina NovaSeq X PlusGenomic DNA≥ 100 ngA260/280=1.8-2.0;
no degradation,
no contamination
Genomic DNA
(PCR free)
≥ 1 μg
Genomic DNA
from FFPE tissue
≥ 300 ngFragments should be ≥ 1500 bp
PacBio Revio DNA HiFi libraryHMW Genomic DNA≥ 3 μgA260/280=1.75-2.0;
A260/230=1.5-2.6;
*NC/QC=1.0-2.2;
Fragments should be ≥ 30 kb
PacBio PCR product libraryPCR product≥ 2 μgOD260/280=1.75~2.0;
OD260/230=1.4~2.6;
*NC/QC=0.95~3.00; Single band
(PacBio library fragments
distributed above 1k)
Nanopore PromethION DNA libraryHMW Genomic DNA≥ 8 μgA260/280=1.75-2.0;
A260/230=1.4-2.6;
*NC/QC=0.95~3.00;
Fragments should be ≥ 30 kb
Nanopore Ultra-long DNA LibraryuHMW Genomic DNA (blood and cells)≥ 30 μgOD260/280=1.7-2.0;
OD260/230=1.3-2.6;
*NC/QC=0.95-3.00;
Fragments should be ≥ 300K, no fragments
below 30k.
Nanopore PCR product libraryPCR product≥ 2 μgOD260/280=1.75~2.0;
OD260/230=1.4~2.6;
*NC/QC=0.95~3.00;
Single band

Sample Requirements

Sample amounts are listed for reference only. Download the Sample Submission Guidelines to learn more. For detailed information, please contact us with your customized requests.


*NC/QC: NanoDrop concentration/Qubit concentration

Platform TypeSample TypeAmount (Qubit®)Purity
Illumina NovaSeq X PlusGenomic DNA≥ 100 ngA260/280=1.8-2.0;
no degradation,
no contamination
Genomic DNA
(PCR free)
≥ 1 μg
Genomic DNA
from FFPE tissue
≥ 300 ngFragments should be ≥ 1500 bp
PacBio Revio DNA HiFi libraryHMW Genomic DNA≥ 3 μgA260/280=1.75-2.0;
A260/230=1.5-2.6;
*NC/QC=1.0-2.2;
Fragments should be ≥ 30 kb
PacBio PCR product libraryPCR product≥ 2 μgOD260/280=1.75~2.0;
OD260/230=1.4~2.6;
*NC/QC=0.95~3.00; Single band
(PacBio library fragments
distributed above 1k)
Nanopore PromethION DNA libraryHMW Genomic DNA≥ 8 μgA260/280=1.75-2.0;
A260/230=1.4-2.6;
*NC/QC=0.95~3.00;
Fragments should be ≥ 30 kb
Nanopore Ultra-long DNA LibraryuHMW Genomic DNA (blood and cells)≥ 30 μgOD260/280=1.7-2.0;
OD260/230=1.3-2.6;
*NC/QC=0.95-3.00;
Fragments should be ≥ 300K, no fragments
below 30k.
Nanopore PCR product libraryPCR product≥ 2 μgOD260/280=1.75~2.0;
OD260/230=1.4~2.6;
*NC/QC=0.95~3.00;
Single band

Sample Requirements

Sample amounts are listed for reference only. Download the Sample Submission Guidelines to learn more. For detailed information, please contact us with your customized requests.


*NC/QC: NanoDrop concentration/Qubit concentration

Platform TypeSample TypeAmount (Qubit®)Purity
Illumina NovaSeq X PlusGenomic DNA≥ 100 ngA260/280=1.8-2.0;
no degradation,
no contamination
Genomic DNA
(PCR free)
≥ 1 μg
Genomic DNA
from FFPE tissue
≥ 300 ngFragments should be ≥ 1500 bp
PacBio Revio DNA HiFi libraryHMW Genomic DNA≥ 3 μgA260/280=1.75-2.0;
A260/230=1.5-2.6;
*NC/QC=1.0-2.2;
Fragments should be ≥ 30 kb
PacBio PCR product libraryPCR product≥ 2 μgOD260/280=1.75~2.0;
OD260/230=1.4~2.6;
*NC/QC=0.95~3.00; Single band
(PacBio library fragments
distributed above 1k)
Nanopore PromethION DNA libraryHMW Genomic DNA≥ 8 μgA260/280=1.75-2.0;
A260/230=1.4-2.6;
*NC/QC=0.95~3.00;
Fragments should be ≥ 30 kb
Nanopore Ultra-long DNA LibraryuHMW Genomic DNA (blood and cells)≥ 30 μgOD260/280=1.7-2.0;
OD260/230=1.3-2.6;
*NC/QC=0.95-3.00;
Fragments should be ≥ 300K, no fragments
below 30k.
Nanopore PCR product libraryPCR product≥ 2 μgOD260/280=1.75~2.0;
OD260/230=1.4~2.6;
*NC/QC=0.95~3.00;
Single band

Sample Requirements

Sample amounts are listed for reference only. Download the Sample Submission Guidelines to learn more. For detailed information, please contact us with your customized requests.


*NC/QC: NanoDrop concentration/Qubit concentration

Platform TypeSample TypeAmount (Qubit®)Purity
Illumina NovaSeq X PlusGenomic DNA≥ 100 ngA260/280=1.8-2.0;
no degradation,
no contamination
Genomic DNA
(PCR free)
≥ 1 μg
Genomic DNA
from FFPE tissue
≥ 300 ngFragments should be ≥ 1500 bp
PacBio Revio DNA HiFi libraryHMW Genomic DNA≥ 3 μgA260/280=1.75-2.0;
A260/230=1.5-2.6;
*NC/QC=1.0-2.2;
Fragments should be ≥ 30 kb
PacBio PCR product libraryPCR product≥ 2 μgOD260/280=1.75~2.0;
OD260/230=1.4~2.6;
*NC/QC=0.95~3.00; Single band
(PacBio library fragments
distributed above 1k)
Nanopore PromethION DNA libraryHMW Genomic DNA≥ 8 μgA260/280=1.75-2.0;
A260/230=1.4-2.6;
*NC/QC=0.95~3.00;
Fragments should be ≥ 30 kb
Nanopore Ultra-long DNA LibraryuHMW Genomic DNA (blood and cells)≥ 30 μgOD260/280=1.7-2.0;
OD260/230=1.3-2.6;
*NC/QC=0.95-3.00;
Fragments should be ≥ 300K, no fragments
below 30k.
Nanopore PCR product libraryPCR product≥ 2 μgOD260/280=1.75~2.0;
OD260/230=1.4~2.6;
*NC/QC=0.95~3.00;
Single band

Sequencing and Analysis

Recommended data outputs and analysis contents displayed are for reference only. For detailed information, please contact us with your customized requests.

Platform TypeIllumina NovaSeq X Plus /NovaSeq6000PacBio RevioNanopore PromethION
Read LengthPaired-end 150 bpAverage > 15 kbAverage > 20 kb
Sequencing DepthRare diseases: 30–50×
Tumor tissues: 50×
Adjacent normal tissues & blood: 30×
Genetic diseases: 10–20×
Tumor tissues: ≥20×
Data qualityGuaranteed ≥ 85% bases with Q30 or higherCondition based
Standard AnalysisData quality control (QC)
Alignment to the reference genome
SNP/InDel/SV/CNV detection
Somatic SNP/InDel/SV/CNV detection for tumor‑normal paired samples
Data quality control (QC)
Sequence alignment
Structural variant (SV) detection
Variant annotation
Advanced AnalysisDisease Advanced Analysis

IBD / Kinship analysis
Variant filtering & ACMG classification
Candidate CNV/SV filtering
Dominant/recessive inheritance modeling
Linkage analysis; ROH detection
Shared‑gene / candidate‑gene screening
Pathway enrichment; gene–disease association
Protein interaction network
HLA typing

Cancer Advanced Analysis

Predisposing gene screening
Mutational spectrum & mutational signatures
Known & novel driver gene identification
SMG & pathway analysis
Somatic Circos visualization
TMB analysis
Driver CNV (GISTIC) & non‑coding driver mutation detection
Tumor purity & ploidy
Intra‑tumor heterogeneity
Fusion gene detection
LOH analysis
HLA typing (tumor/normal)

Personalized / Optional Add‑Ons

CRISPR/Cas9 off‑target analysis
Xenograft (PDX) tumor analysis
Integration site detection
Somatic SNV/INDEL for single tumor
Neoantigen prediction
Tumor evolution (≥3 tumor samples)
gVCF file generation
-

Sequencing and Analysis

Recommended data outputs and analysis contents displayed are for reference only. For detailed information, please contact us with your customized requests.

Platform TypeIllumina NovaSeq X Plus /NovaSeq6000PacBio RevioNanopore PromethION
Read LengthPaired-end 150 bpAverage > 15 kbAverage > 20 kb
Sequencing DepthRare diseases: 30–50×
Tumor tissues: 50×
Adjacent normal tissues & blood: 30×
Genetic diseases: 10–20×
Tumor tissues: ≥20×
Data qualityGuaranteed ≥ 85% bases with Q30 or higherCondition based
Standard AnalysisData quality control (QC)
Alignment to the reference genome
SNP/InDel/SV/CNV detection
Somatic SNP/InDel/SV/CNV detection for tumor‑normal paired samples
Data quality control (QC)
Sequence alignment
Structural variant (SV) detection
Variant annotation
Advanced AnalysisDisease Advanced Analysis

IBD / Kinship analysis
Variant filtering & ACMG classification
Candidate CNV/SV filtering
Dominant/recessive inheritance modeling
Linkage analysis; ROH detection
Shared‑gene / candidate‑gene screening
Pathway enrichment; gene–disease association
Protein interaction network
HLA typing

Cancer Advanced Analysis

Predisposing gene screening
Mutational spectrum & mutational signatures
Known & novel driver gene identification
SMG & pathway analysis
Somatic Circos visualization
TMB analysis
Driver CNV (GISTIC) & non‑coding driver mutation detection
Tumor purity & ploidy
Intra‑tumor heterogeneity
Fusion gene detection
LOH analysis
HLA typing (tumor/normal)

Personalized / Optional Add‑Ons

CRISPR/Cas9 off‑target analysis
Xenograft (PDX) tumor analysis
Integration site detection
Somatic SNV/INDEL for single tumor
Neoantigen prediction
Tumor evolution (≥3 tumor samples)
gVCF file generation
-

Sequencing and Analysis

Recommended data outputs and analysis contents displayed are for reference only. For detailed information, please contact us with your customized requests.

Platform TypeIllumina NovaSeq X Plus /NovaSeq6000PacBio RevioNanopore PromethION
Read LengthPaired-end 150 bpAverage > 15 kbAverage > 20 kb
Sequencing DepthRare diseases: 30–50×
Tumor tissues: 50×
Adjacent normal tissues & blood: 30×
Genetic diseases: 10–20×
Tumor tissues: ≥20×
Data qualityGuaranteed ≥ 85% bases with Q30 or higherCondition based
Standard AnalysisData quality control (QC)
Alignment to the reference genome
SNP/InDel/SV/CNV detection
Somatic SNP/InDel/SV/CNV detection for tumor‑normal paired samples
Data quality control (QC)
Sequence alignment
Structural variant (SV) detection
Variant annotation
Advanced AnalysisDisease Advanced Analysis

IBD / Kinship analysis
Variant filtering & ACMG classification
Candidate CNV/SV filtering
Dominant/recessive inheritance modeling
Linkage analysis; ROH detection
Shared‑gene / candidate‑gene screening
Pathway enrichment; gene–disease association
Protein interaction network
HLA typing

Cancer Advanced Analysis

Predisposing gene screening
Mutational spectrum & mutational signatures
Known & novel driver gene identification
SMG & pathway analysis
Somatic Circos visualization
TMB analysis
Driver CNV (GISTIC) & non‑coding driver mutation detection
Tumor purity & ploidy
Intra‑tumor heterogeneity
Fusion gene detection
LOH analysis
HLA typing (tumor/normal)

Personalized / Optional Add‑Ons

CRISPR/Cas9 off‑target analysis
Xenograft (PDX) tumor analysis
Integration site detection
Somatic SNV/INDEL for single tumor
Neoantigen prediction
Tumor evolution (≥3 tumor samples)
gVCF file generation
-

Sequencing and Analysis

Recommended data outputs and analysis contents displayed are for reference only. For detailed information, please contact us with your customized requests.

Platform TypeIllumina NovaSeq X Plus /NovaSeq6000PacBio RevioNanopore PromethION
Read LengthPaired-end 150 bpAverage > 15 kbAverage > 20 kb
Sequencing DepthRare diseases: 30–50×
Tumor tissues: 50×
Adjacent normal tissues & blood: 30×
Genetic diseases: 10–20×
Tumor tissues: ≥20×
Data qualityGuaranteed ≥ 85% bases with Q30 or higherCondition based
Standard AnalysisData quality control (QC)
Alignment to the reference genome
SNP/InDel/SV/CNV detection
Somatic SNP/InDel/SV/CNV detection for tumor‑normal paired samples
Data quality control (QC)
Sequence alignment
Structural variant (SV) detection
Variant annotation
Advanced AnalysisDisease Advanced Analysis

IBD / Kinship analysis
Variant filtering & ACMG classification
Candidate CNV/SV filtering
Dominant/recessive inheritance modeling
Linkage analysis; ROH detection
Shared‑gene / candidate‑gene screening
Pathway enrichment; gene–disease association
Protein interaction network
HLA typing

Cancer Advanced Analysis

Predisposing gene screening
Mutational spectrum & mutational signatures
Known & novel driver gene identification
SMG & pathway analysis
Somatic Circos visualization
TMB analysis
Driver CNV (GISTIC) & non‑coding driver mutation detection
Tumor purity & ploidy
Intra‑tumor heterogeneity
Fusion gene detection
LOH analysis
HLA typing (tumor/normal)

Personalized / Optional Add‑Ons

CRISPR/Cas9 off‑target analysis
Xenograft (PDX) tumor analysis
Integration site detection
Somatic SNV/INDEL for single tumor
Neoantigen prediction
Tumor evolution (≥3 tumor samples)
gVCF file generation
-

Project Workflow

From sample preparation and library construction through sequencing, data quality control, and bioinformatics analysis, Novogene delivers a streamlined hWGS workflow supported by defined QC checkpoints and standardized procedures to ensure reliable results.

Project Workflow

Project Workflow

From sample preparation and library construction through sequencing, data quality control, and bioinformatics analysis, Novogene delivers a streamlined hWGS workflow supported by defined QC checkpoints and standardized procedures to ensure reliable results.

Project Workflow

Project Workflow

From sample preparation and library construction through sequencing, data quality control, and bioinformatics analysis, Novogene delivers a streamlined hWGS workflow supported by defined QC checkpoints and standardized procedures to ensure reliable results.

Project Workflow

Project Workflow

From sample preparation and library construction through sequencing, data quality control, and bioinformatics analysis, Novogene delivers a streamlined hWGS workflow supported by defined QC checkpoints and standardized procedures to ensure reliable results.

Project Workflow

Demo Results

Image
Image
1/1
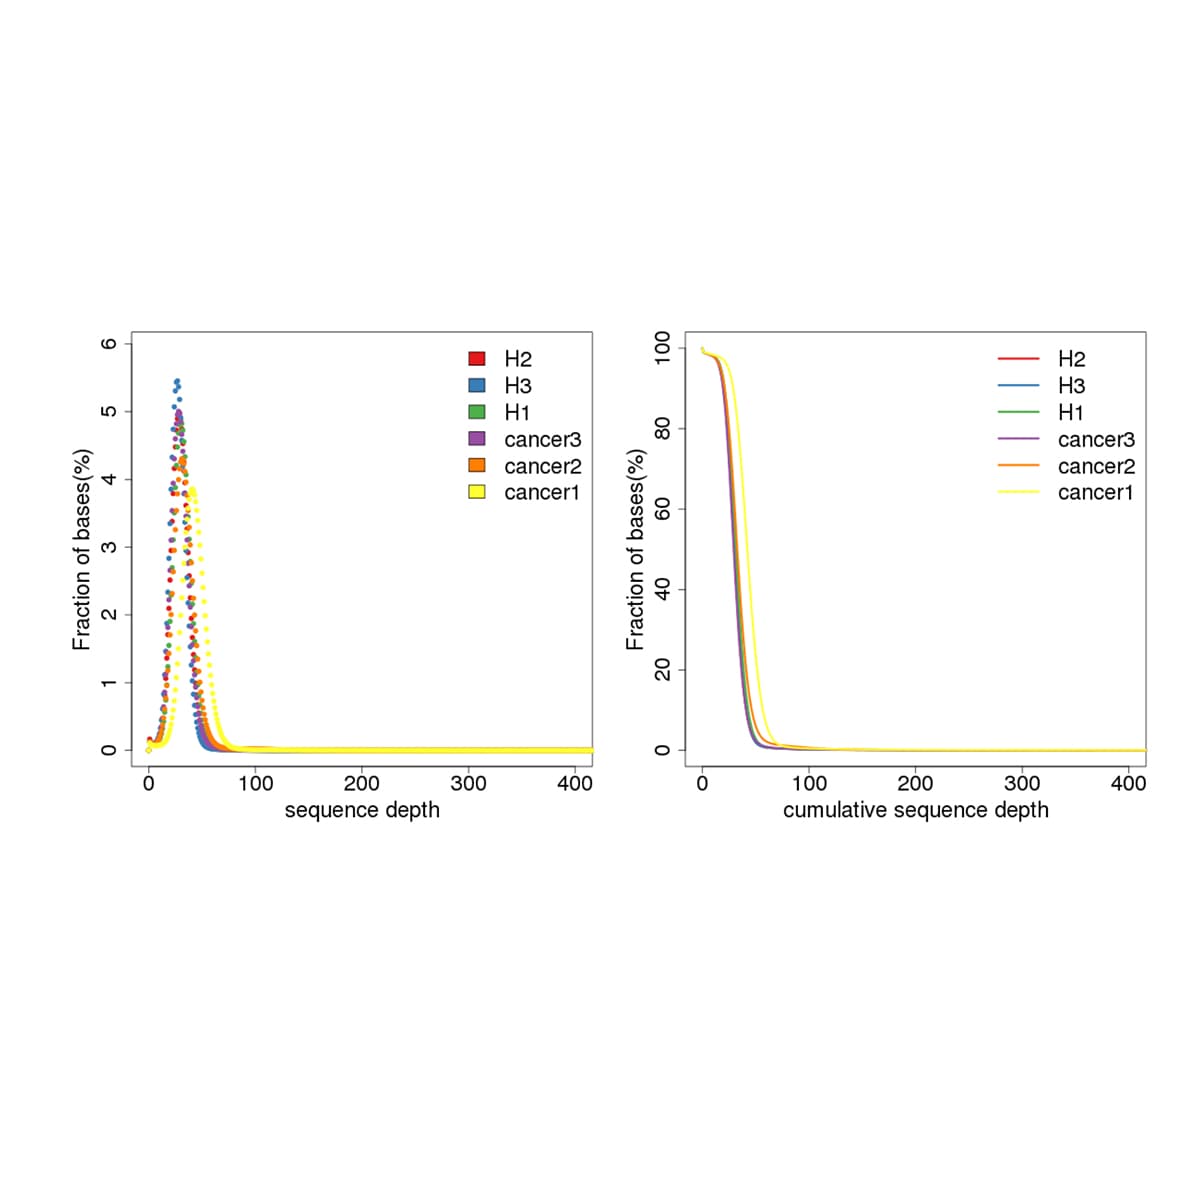
Sequencing Depth Distribution

Left panel: distribution of sequencing depth across all bases per sample (x: depth, y: fraction of bases at each depth). Right panel: cumulative depth distribution (x: cumulative depth, y: fraction of bases at depth ≥ the specified value).

Image
Image
1/1
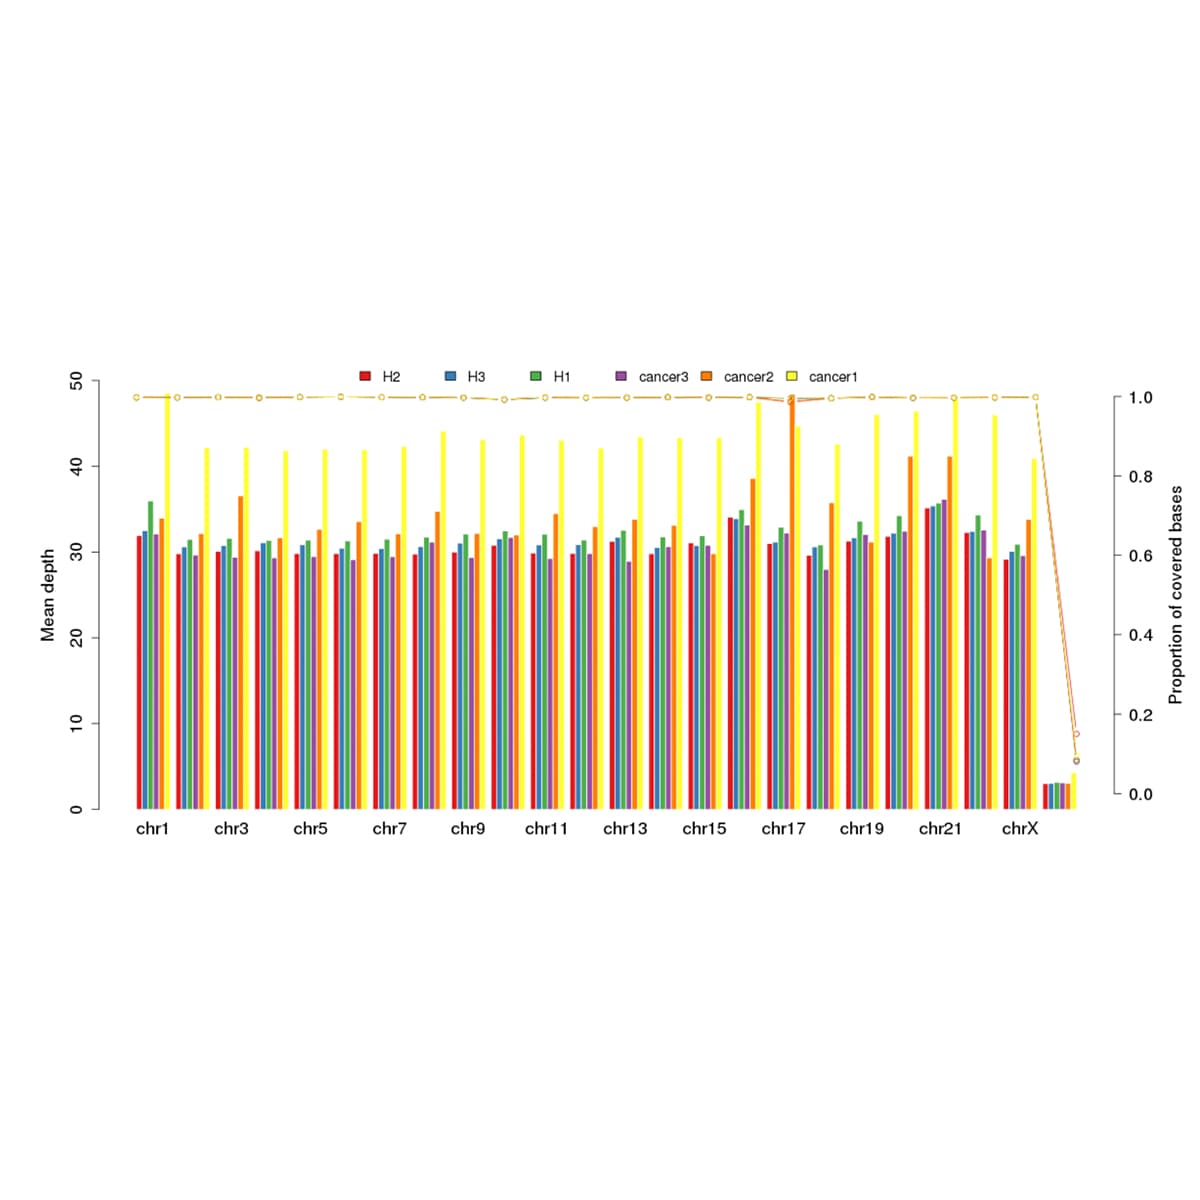
Chromosome Level Average Depth and Coverage

Bar chart shows the average sequencing depth per chromosome (left y axis).

Line plot shows coverage (fraction of bases covered) per chromosome (right y axis).

The x axis represents chromosomes.

Image
Image
1/1
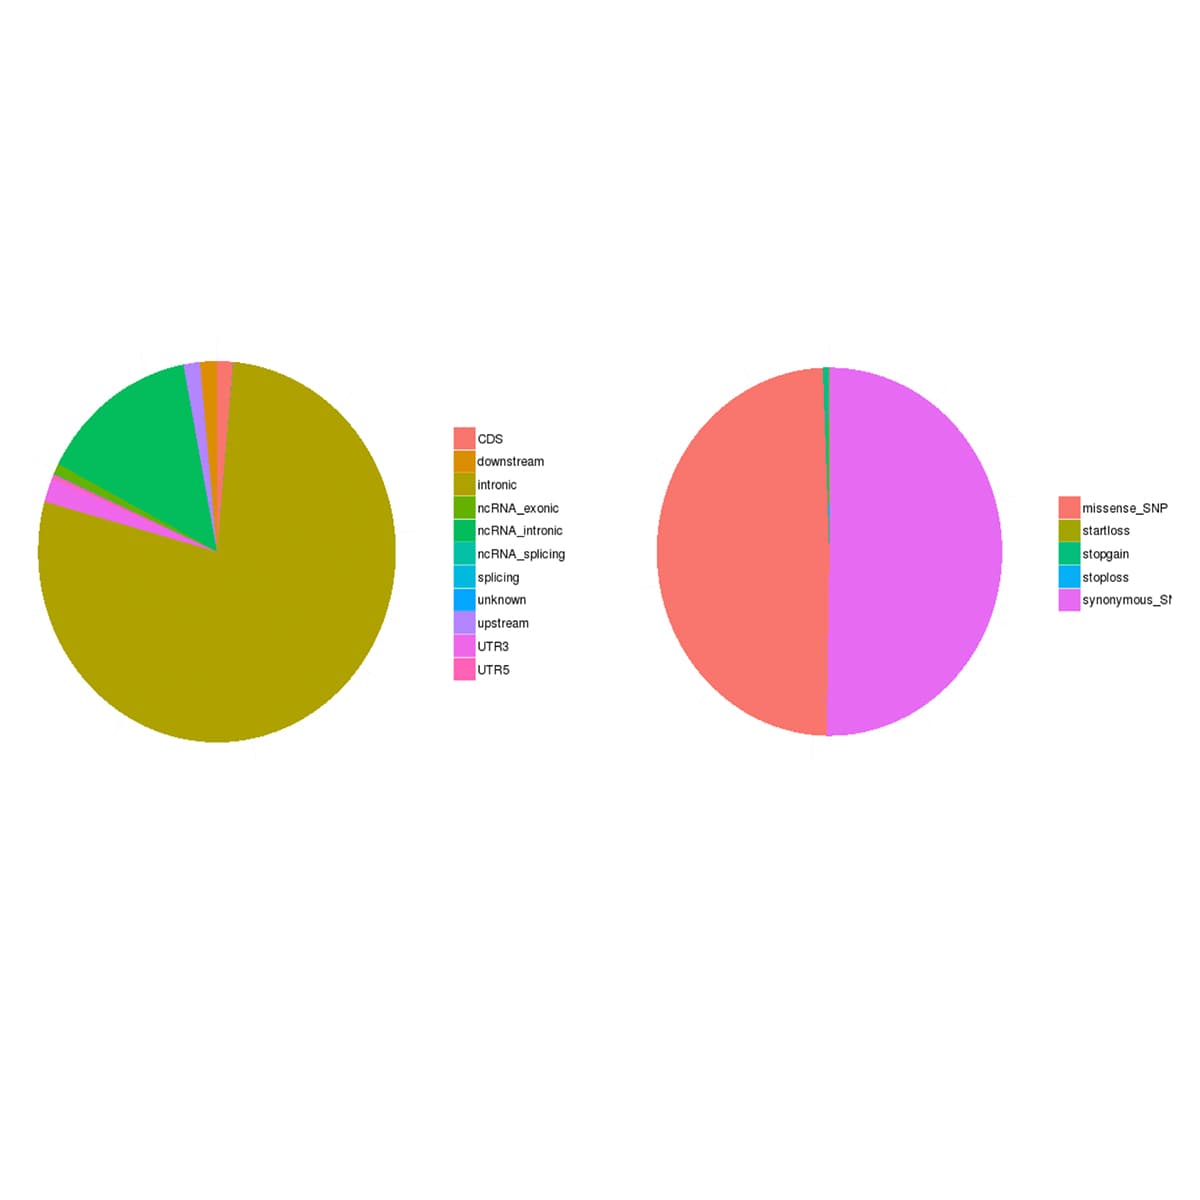
SNP Distribution

Left panel: Number of SNPs located in different genomic regions (pie chart).

Right panel: Classification of SNP types within coding regions (pie chart).

Image
Image
1/1
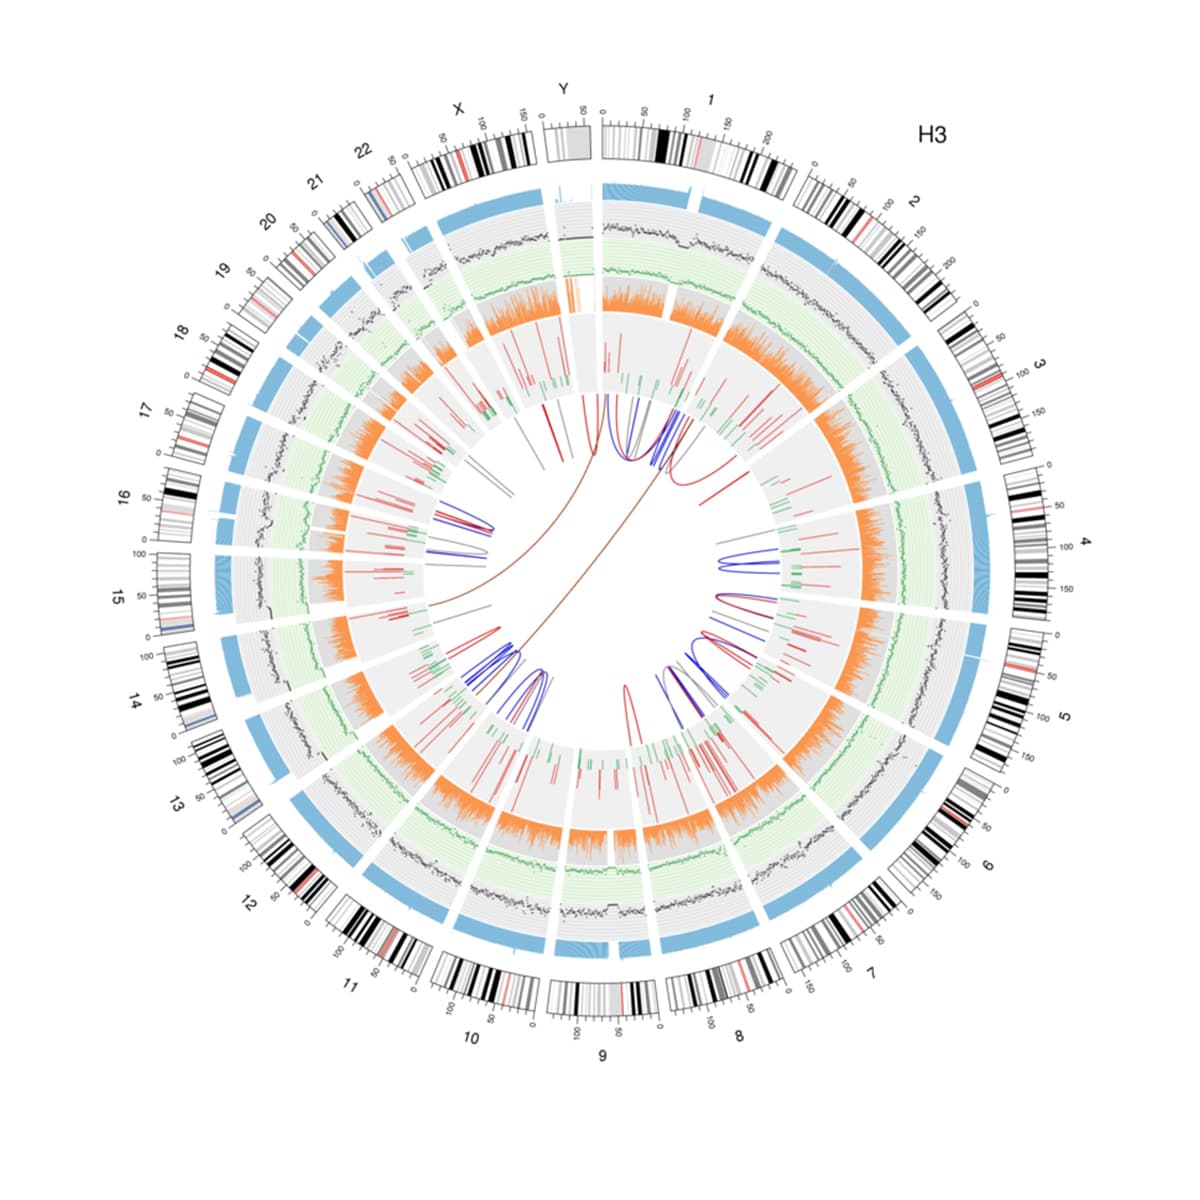
Circos Plot

Genome wide visualization of genomic variants displayed using a Circos plot.

Image
Image
1/1
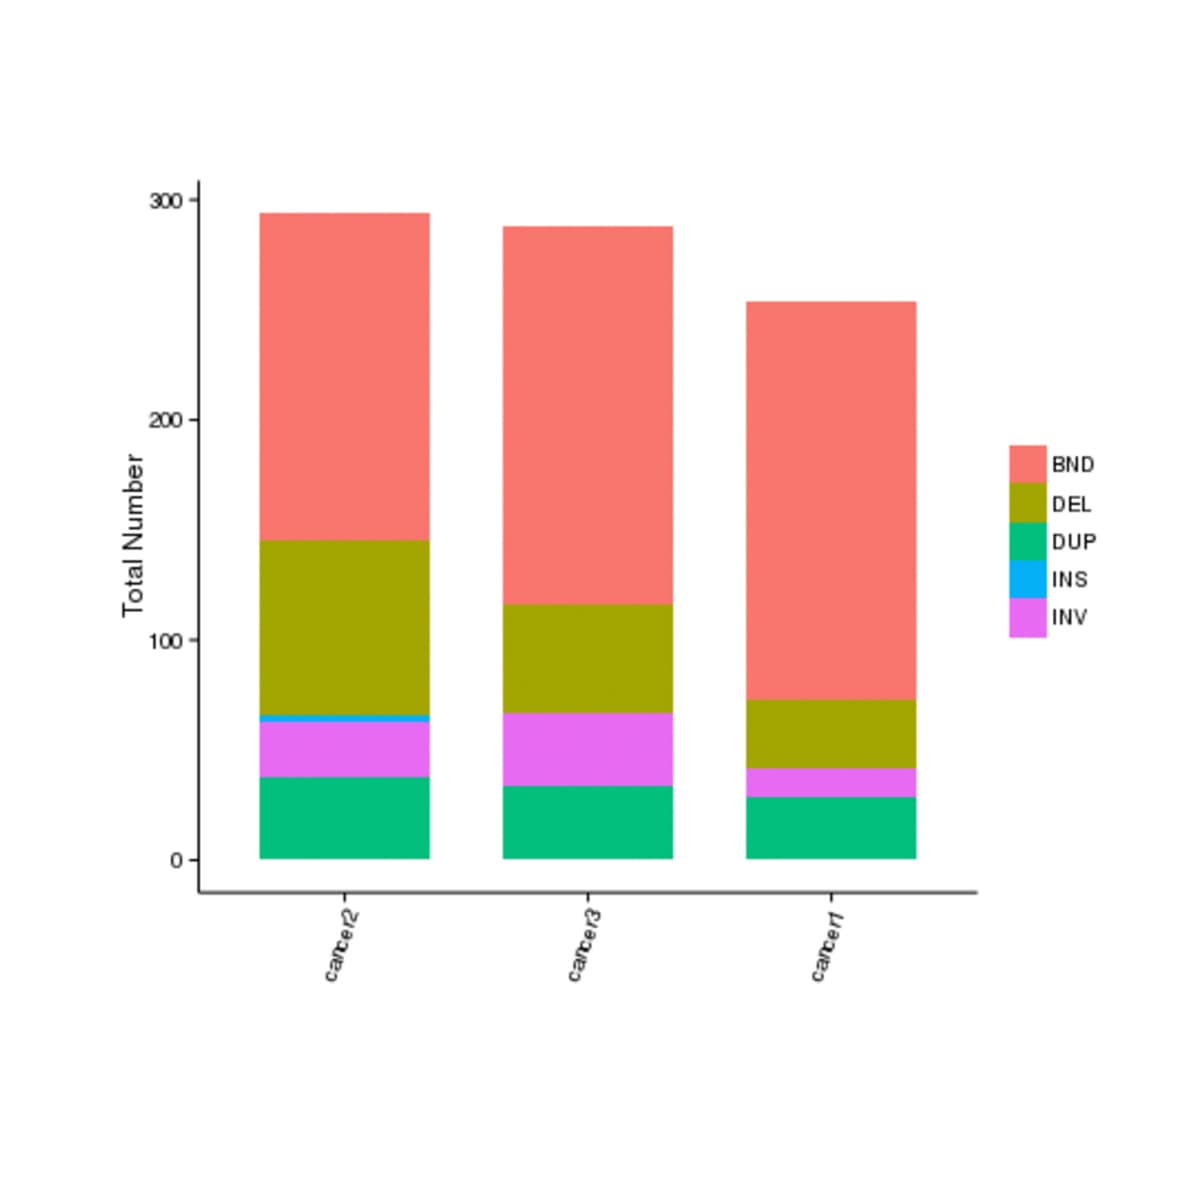
Somatic Structural Variant Counts

Number of somatic SV types detected in each sample.

The x axis represents samples, and the y axis represents the count of each SV category.

Image
Image
1/1
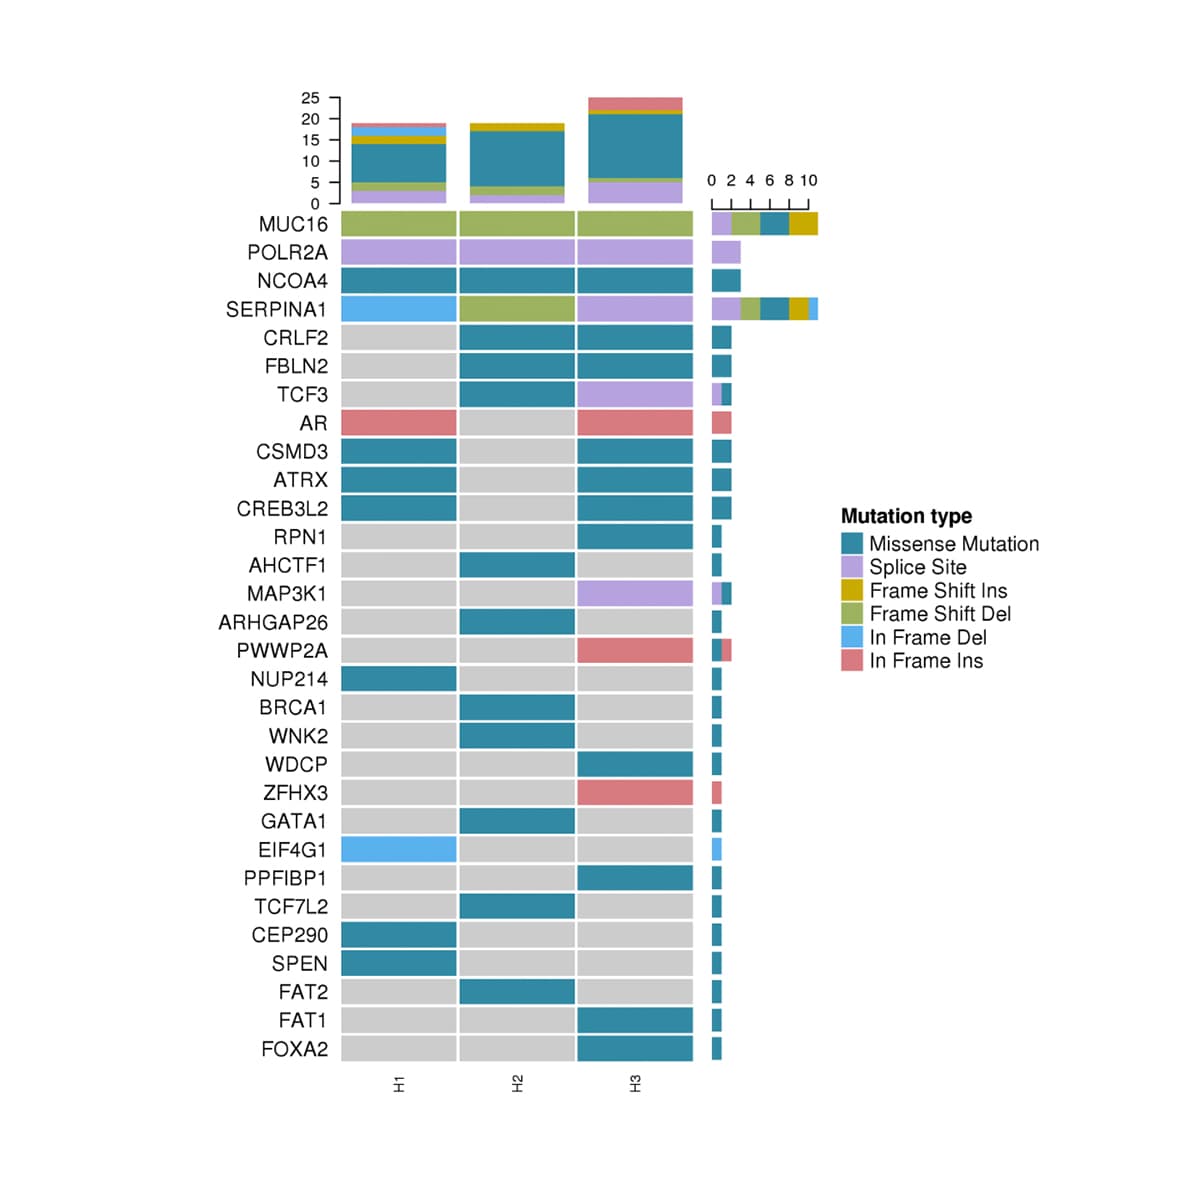
Predisposing Gene Landscape

Heatmap of mutations in susceptibility genes. X: samples; Y: genes; top bar: mutations per sample; right bar: mutations per gene. Shows top 30 genes; samples with no mutations hidden by default.

Image
Image
1/1
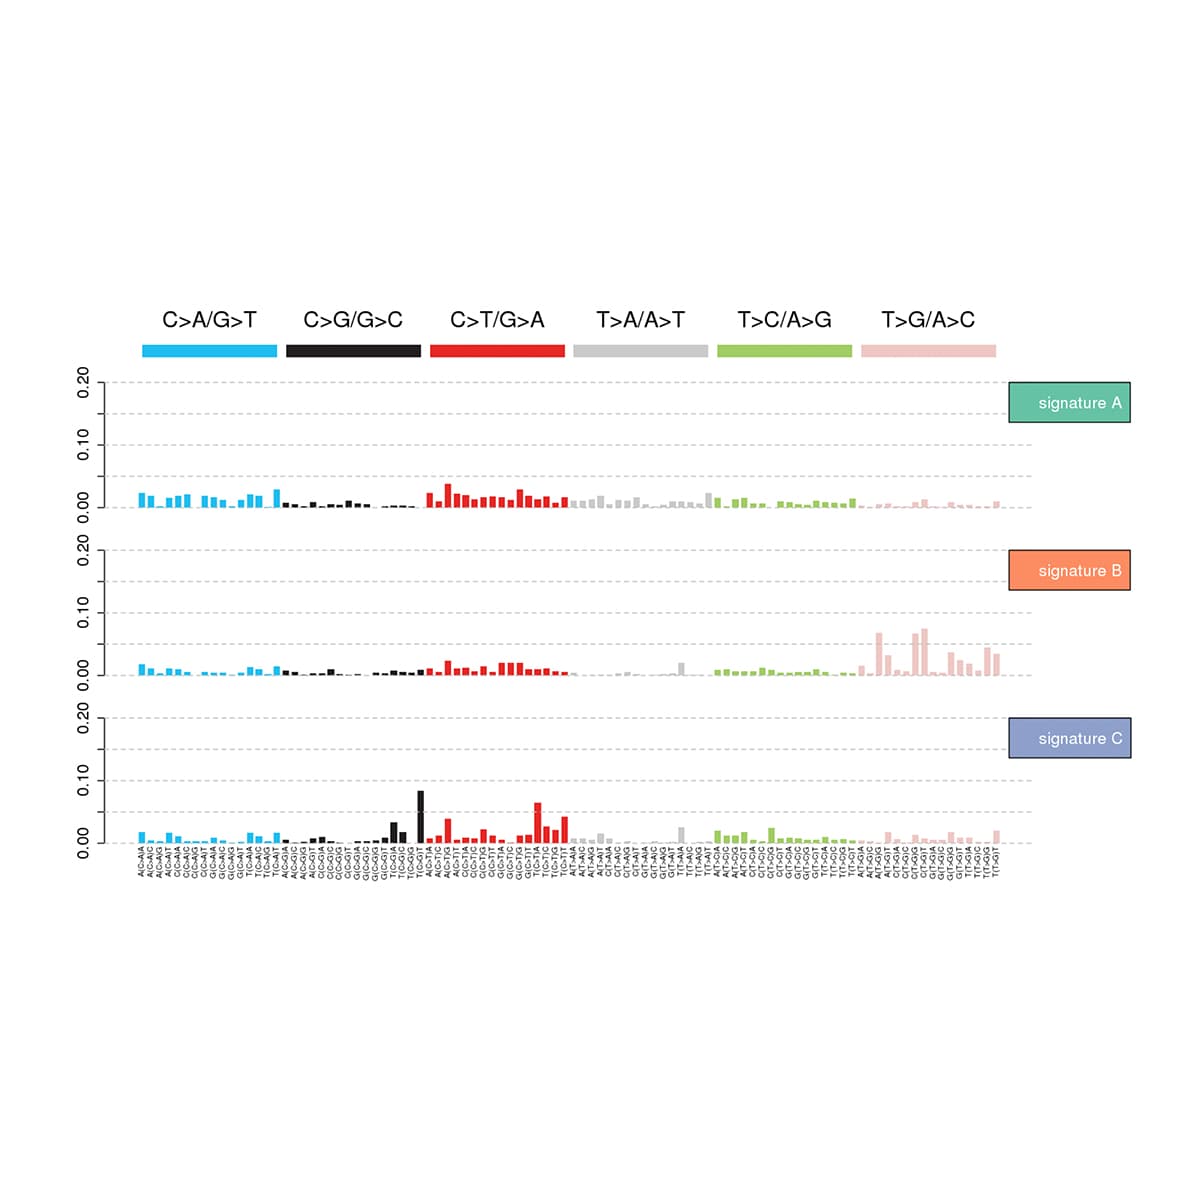
Mutational Signatures

P1: signature profiles—mutation types (x) vs. contributions (y). P2: signature proportions per sample. P3: cosine-similarity clustering vs. 30 COSMIC signatures (darker = closer match).

Image
Image
1/1
Sequencing Depth Distribution

Left panel: distribution of sequencing depth across all bases per sample (x: depth, y: fraction of bases at each depth). Right panel: cumulative depth distribution (x: cumulative depth, y: fraction of bases at depth ≥ the specified value).

Image
Image
1/1
Chromosome Level Average Depth and Coverage

Bar chart shows the average sequencing depth per chromosome (left y axis).

Line plot shows coverage (fraction of bases covered) per chromosome (right y axis).

The x axis represents chromosomes.

Image
Image
1/1
SNP Distribution

Left panel: Number of SNPs located in different genomic regions (pie chart).

Right panel: Classification of SNP types within coding regions (pie chart).

Image
Image
1/1
Circos Plot

Genome wide visualization of genomic variants displayed using a Circos plot.

Image
Image
1/1
Somatic Structural Variant Counts

Number of somatic SV types detected in each sample.

The x axis represents samples, and the y axis represents the count of each SV category.

Image
Image
1/1
Predisposing Gene Landscape

Heatmap of mutations in susceptibility genes. X: samples; Y: genes; top bar: mutations per sample; right bar: mutations per gene. Shows top 30 genes; samples with no mutations hidden by default.

Image
Image
1/1
Mutational Signatures

P1: signature profiles—mutation types (x) vs. contributions (y). P2: signature proportions per sample. P3: cosine-similarity clustering vs. 30 COSMIC signatures (darker = closer match).

Demo Results

Image
Image
1/1
Sequencing Depth Distribution

Left panel: distribution of sequencing depth across all bases per sample (x: depth, y: fraction of bases at each depth). Right panel: cumulative depth distribution (x: cumulative depth, y: fraction of bases at depth ≥ the specified value).

Image
Image
1/1
Chromosome Level Average Depth and Coverage

Bar chart shows the average sequencing depth per chromosome (left y axis).

Line plot shows coverage (fraction of bases covered) per chromosome (right y axis).

The x axis represents chromosomes.

Image
Image
1/1
SNP Distribution

Left panel: Number of SNPs located in different genomic regions (pie chart).

Right panel: Classification of SNP types within coding regions (pie chart).

Image
Image
1/1
Circos Plot

Genome wide visualization of genomic variants displayed using a Circos plot.

Image
Image
1/1
Somatic Structural Variant Counts

Number of somatic SV types detected in each sample.

The x axis represents samples, and the y axis represents the count of each SV category.

Image
Image
1/1
Predisposing Gene Landscape

Heatmap of mutations in susceptibility genes. X: samples; Y: genes; top bar: mutations per sample; right bar: mutations per gene. Shows top 30 genes; samples with no mutations hidden by default.

Image
Image
1/1
Mutational Signatures

P1: signature profiles—mutation types (x) vs. contributions (y). P2: signature proportions per sample. P3: cosine-similarity clustering vs. 30 COSMIC signatures (darker = closer match).

Image
Image
1/1
Sequencing Depth Distribution

Left panel: distribution of sequencing depth across all bases per sample (x: depth, y: fraction of bases at each depth). Right panel: cumulative depth distribution (x: cumulative depth, y: fraction of bases at depth ≥ the specified value).

Image
Image
1/1
Chromosome Level Average Depth and Coverage

Bar chart shows the average sequencing depth per chromosome (left y axis).

Line plot shows coverage (fraction of bases covered) per chromosome (right y axis).

The x axis represents chromosomes.

Image
Image
1/1
SNP Distribution

Left panel: Number of SNPs located in different genomic regions (pie chart).

Right panel: Classification of SNP types within coding regions (pie chart).

Image
Image
1/1
Circos Plot

Genome wide visualization of genomic variants displayed using a Circos plot.

Image
Image
1/1
Somatic Structural Variant Counts

Number of somatic SV types detected in each sample.

The x axis represents samples, and the y axis represents the count of each SV category.

Image
Image
1/1
Predisposing Gene Landscape

Heatmap of mutations in susceptibility genes. X: samples; Y: genes; top bar: mutations per sample; right bar: mutations per gene. Shows top 30 genes; samples with no mutations hidden by default.

Image
Image
1/1
Mutational Signatures

P1: signature profiles—mutation types (x) vs. contributions (y). P2: signature proportions per sample. P3: cosine-similarity clustering vs. 30 COSMIC signatures (darker = closer match).

Frequently Asked Questions

What sample types are accepted?

•Illumina: Genomic DNA ≥100 ng (A260/280 1.8–2.0); PCR free ≥1 µg; FFPE ≥300 ng with fragments ≥1,500 bp.

•PacBio: ≥3 µg high molecular weight DNA, fragments ≥30 kb.

•Nanopore: ≥8 µg HMW DNA or ≥30 µg ultra HMW DNA, fragments ≥30–300 kb.

What sequencing depth should I choose?

Do you offer short read and long read WGS?

What files do I receive?

How are difficult genomic regions handled?

What is the turnaround time?

How is data delivered securely?

More Services

Shotgun Metagenomics Sequencing
(Shotgun Metagenomics Sequencing)
Shotgun Metagenomics Sequencing
(Shotgun Metagenomics Sequencing)
Plant and Animal Whole Genome Sequencing
(Plant and Animal Whole Genome Sequencing)
Plant and Animal Whole Genome Sequencing
(Plant and Animal Whole Genome Sequencing)
Microbial Whole Genome Sequencing
(Microbial Whole Genome Sequencing)
Microbial Whole Genome Sequencing
(Microbial Whole Genome Sequencing)
Whole Exome Sequencing
(Whole Exome Sequencing)
Whole Exome Sequencing
(Whole Exome Sequencing)
Whole Genome Bisulfite Sequencing (WGBS)
(Whole Genome Bisulfite Sequencing (WGBS))
Whole Genome Bisulfite Sequencing (WGBS)
(Whole Genome Bisulfite Sequencing (WGBS))

More Services

Shotgun Metagenomics Sequencing
(Shotgun Metagenomics Sequencing)
Shotgun Metagenomics Sequencing
(Shotgun Metagenomics Sequencing)
Plant and Animal Whole Genome Sequencing
(Plant and Animal Whole Genome Sequencing)
Plant and Animal Whole Genome Sequencing
(Plant and Animal Whole Genome Sequencing)
Microbial Whole Genome Sequencing
(Microbial Whole Genome Sequencing)
Microbial Whole Genome Sequencing
(Microbial Whole Genome Sequencing)
Whole Exome Sequencing
(Whole Exome Sequencing)
Whole Exome Sequencing
(Whole Exome Sequencing)
Whole Genome Bisulfite Sequencing (WGBS)
(Whole Genome Bisulfite Sequencing (WGBS))
Whole Genome Bisulfite Sequencing (WGBS)
(Whole Genome Bisulfite Sequencing (WGBS))
Background
Background

Ready to Start Your Project?

Our platform offers tailored solutions for

your unique experimental needs, ensuring a seamless experience from project design to data delivery.


Your Privacy ChoicesPrivacy PolicyCookie PolicyCareers
banner laptop bg
banner mobile bg

Human Whole Genome Sequencing

OverviewOverview
BenefitsBenefits
ApplicationsApplications
SpecificationsSpecifications
ResourcesResources

Human whole genome sequencing (hWGS) provides a broad, unbiased view of the human genome for both germline and somatic variant discovery. A single assay detects SNPs, InDels, structural variants (SVs) and copy number variants (CNVs) across coding and non coding regions, offering comprehensive resolution for studies in rare and inherited diseases, cancer genomics, population genetics, pharmacogenomics, and the development or validation of new analytical methods.


Novogene supports projects of all scales, from individual samples to large cohort programs, using robust QC checkpoints, validated workflows, and flexible sequencing strategies. Researchers can choose between short read and long read approaches on leading platforms including Illumina NovaSeq X Plus, Oxford Nanopore PromethION, and PacBio Revio. This multi technology framework enables tailored study designs that improve SV detection, clarify variant interpretation in highly repetitive or polymorphic regions, and streamline high throughput sequencing needs.

Deliverables may include FASTQ, BAM/CRAM, VCF, and clear analysis summaries with publication ready outputs. Optional bioinformatics support extends from standard pipelines to more advanced interpretation, helping teams transition efficiently from raw data to meaningful, actionable insights.

Benefits of Novogene Human Whole Genome Sequencing (hWGS)

High Quality Data Delivery High Quality Data Delivery
High Quality Data Delivery

Robust QC checkpoints and transparent delivery metrics ensure accurate, reliable data aligned with project requirements.

High Quality Data Delivery

Robust QC checkpoints and transparent delivery metrics ensure accurate, reliable data aligned with project requirements.

Flexible Short Read and Long Read Sequencing Flexible Short Read and Long Read Sequencing
Flexible Short Read and Long Read Sequencing

Choose short read or long read options on leading platforms, enabling optimized detection even in complex or repetitive regions.

Flexible Short Read and Long Read Sequencing

Choose short read or long read options on leading platforms, enabling optimized detection even in complex or repetitive regions.

Excellent Variant Detection Excellent Variant Detection
Excellent Variant Detection

High depth, uniform coverage delivers strong performance for heterozygous variants.

Excellent Variant Detection

High depth, uniform coverage delivers strong performance for heterozygous variants.

Comprehensive Bioinformatics and Expert Interpretation Comprehensive Bioinformatics and Expert Interpretation
Comprehensive Bioinformatics and Expert Interpretation

End to end outputs paired with optional advanced bioinformatics analysis and publication ready figures.

Comprehensive Bioinformatics and Expert Interpretation

End to end outputs paired with optional advanced bioinformatics analysis and publication ready figures.

Scalable Project SupportScalable Project Support
Scalable Project Support

Standardized coordination and documentation streamline both pilot scale and cohort scale hWGS projects.

Scalable Project Support

Standardized coordination and documentation streamline both pilot scale and cohort scale hWGS projects.

Benefits of Novogene Human Whole Genome Sequencing (hWGS)

High Quality Data Delivery High Quality Data Delivery
High Quality Data Delivery

Robust QC checkpoints and transparent delivery metrics ensure accurate, reliable data aligned with project requirements.

High Quality Data Delivery

Robust QC checkpoints and transparent delivery metrics ensure accurate, reliable data aligned with project requirements.

Flexible Short Read and Long Read Sequencing Flexible Short Read and Long Read Sequencing
Flexible Short Read and Long Read Sequencing

Choose short read or long read options on leading platforms, enabling optimized detection even in complex or repetitive regions.

Flexible Short Read and Long Read Sequencing

Choose short read or long read options on leading platforms, enabling optimized detection even in complex or repetitive regions.

Excellent Variant Detection Excellent Variant Detection
Excellent Variant Detection

High depth, uniform coverage delivers strong performance for heterozygous variants.

Excellent Variant Detection

High depth, uniform coverage delivers strong performance for heterozygous variants.

Comprehensive Bioinformatics and Expert Interpretation Comprehensive Bioinformatics and Expert Interpretation
Comprehensive Bioinformatics and Expert Interpretation

End to end outputs paired with optional advanced bioinformatics analysis and publication ready figures.

Comprehensive Bioinformatics and Expert Interpretation

End to end outputs paired with optional advanced bioinformatics analysis and publication ready figures.

Scalable Project SupportScalable Project Support
Scalable Project Support

Standardized coordination and documentation streamline both pilot scale and cohort scale hWGS projects.

Scalable Project Support

Standardized coordination and documentation streamline both pilot scale and cohort scale hWGS projects.

Applications of Human Whole Genome Sequencing

Human whole genome sequencing (hWGS) supports a wide range of research needs, providing genome wide visibility into genetic diseases, cancer biology, pathogenesis mechanisms, and human population history.

Identifying Novel Disease Genes

Sequencing individuals with similar unexplained syndromes helps researchers pinpoint shared pathogenic variants, enabling discovery of new rare disease genes and expanding understanding of inherited disorders.

Identifying Novel Disease Genes

Sequencing individuals with similar unexplained syndromes helps researchers pinpoint shared pathogenic variants, enabling discovery of new rare disease genes and expanding understanding of inherited disorders.

Detecting Cancer Driver Mutations

hWGS can identify driver mutations that promote tumor growth, distinguishing causative changes from background variants and uncovering novel pathways in cancer genomics.

Detecting Cancer Driver Mutations

hWGS can identify driver mutations that promote tumor growth, distinguishing causative changes from background variants and uncovering novel pathways in cancer genomics.

Understanding Virulence and Antibiotic Resistance

By comparing genomes across strains, WGS reveals genetic determinants of virulence, antibiotic resistance, and host adaptation—providing insight into the molecular basis of pathogenesis.

Understanding Virulence and Antibiotic Resistance

By comparing genomes across strains, WGS reveals genetic determinants of virulence, antibiotic resistance, and host adaptation—providing insight into the molecular basis of pathogenesis.

Tracing Human Population Origins and Migration

Genome wide variant comparisons help reconstruct population genetics, ancestry, admixture, and ancient migration routes, enabling deeper study of human evolutionary history.

Tracing Human Population Origins and Migration

Genome wide variant comparisons help reconstruct population genetics, ancestry, admixture, and ancient migration routes, enabling deeper study of human evolutionary history.

Applications of Human Whole Genome Sequencing

Human whole genome sequencing (hWGS) supports a wide range of research needs, providing genome wide visibility into genetic diseases, cancer biology, pathogenesis mechanisms, and human population history.

Identifying Novel Disease Genes

Sequencing individuals with similar unexplained syndromes helps researchers pinpoint shared pathogenic variants, enabling discovery of new rare disease genes and expanding understanding of inherited disorders.

Identifying Novel Disease Genes

Sequencing individuals with similar unexplained syndromes helps researchers pinpoint shared pathogenic variants, enabling discovery of new rare disease genes and expanding understanding of inherited disorders.

Detecting Cancer Driver Mutations

hWGS can identify driver mutations that promote tumor growth, distinguishing causative changes from background variants and uncovering novel pathways in cancer genomics.

Detecting Cancer Driver Mutations

hWGS can identify driver mutations that promote tumor growth, distinguishing causative changes from background variants and uncovering novel pathways in cancer genomics.

Understanding Virulence and Antibiotic Resistance

By comparing genomes across strains, WGS reveals genetic determinants of virulence, antibiotic resistance, and host adaptation—providing insight into the molecular basis of pathogenesis.

Understanding Virulence and Antibiotic Resistance

By comparing genomes across strains, WGS reveals genetic determinants of virulence, antibiotic resistance, and host adaptation—providing insight into the molecular basis of pathogenesis.

Tracing Human Population Origins and Migration

Genome wide variant comparisons help reconstruct population genetics, ancestry, admixture, and ancient migration routes, enabling deeper study of human evolutionary history.

Tracing Human Population Origins and Migration

Genome wide variant comparisons help reconstruct population genetics, ancestry, admixture, and ancient migration routes, enabling deeper study of human evolutionary history.

Specifications

Sample Requirements

Sample amounts are listed for reference only. Download the Sample Submission Guidelines to learn more. For detailed information, please contact us with your customized requests.


*NC/QC: NanoDrop concentration/Qubit concentration

Platform TypeSample TypeAmount (Qubit®)Purity
Illumina NovaSeq X PlusGenomic DNA≥ 100 ngA260/280=1.8-2.0;
no degradation,
no contamination
Genomic DNA
(PCR free)
≥ 1 μg
Genomic DNA
from FFPE tissue
≥ 300 ngFragments should be ≥ 1500 bp
PacBio Revio DNA HiFi libraryHMW Genomic DNA≥ 3 μgA260/280=1.75-2.0;
A260/230=1.5-2.6;
*NC/QC=1.0-2.2;
Fragments should be ≥ 30 kb
PacBio PCR product libraryPCR product≥ 2 μgOD260/280=1.75~2.0;
OD260/230=1.4~2.6;
*NC/QC=0.95~3.00; Single band
(PacBio library fragments
distributed above 1k)
Nanopore PromethION DNA libraryHMW Genomic DNA≥ 8 μgA260/280=1.75-2.0;
A260/230=1.4-2.6;
*NC/QC=0.95~3.00;
Fragments should be ≥ 30 kb
Nanopore Ultra-long DNA LibraryuHMW Genomic DNA (blood and cells)≥ 30 μgOD260/280=1.7-2.0;
OD260/230=1.3-2.6;
*NC/QC=0.95-3.00;
Fragments should be ≥ 300K, no fragments
below 30k.
Nanopore PCR product libraryPCR product≥ 2 μgOD260/280=1.75~2.0;
OD260/230=1.4~2.6;
*NC/QC=0.95~3.00;
Single band

Sample Requirements

Sample amounts are listed for reference only. Download the Sample Submission Guidelines to learn more. For detailed information, please contact us with your customized requests.


*NC/QC: NanoDrop concentration/Qubit concentration

Platform TypeSample TypeAmount (Qubit®)Purity
Illumina NovaSeq X PlusGenomic DNA≥ 100 ngA260/280=1.8-2.0;
no degradation,
no contamination
Genomic DNA
(PCR free)
≥ 1 μg
Genomic DNA
from FFPE tissue
≥ 300 ngFragments should be ≥ 1500 bp
PacBio Revio DNA HiFi libraryHMW Genomic DNA≥ 3 μgA260/280=1.75-2.0;
A260/230=1.5-2.6;
*NC/QC=1.0-2.2;
Fragments should be ≥ 30 kb
PacBio PCR product libraryPCR product≥ 2 μgOD260/280=1.75~2.0;
OD260/230=1.4~2.6;
*NC/QC=0.95~3.00; Single band
(PacBio library fragments
distributed above 1k)
Nanopore PromethION DNA libraryHMW Genomic DNA≥ 8 μgA260/280=1.75-2.0;
A260/230=1.4-2.6;
*NC/QC=0.95~3.00;
Fragments should be ≥ 30 kb
Nanopore Ultra-long DNA LibraryuHMW Genomic DNA (blood and cells)≥ 30 μgOD260/280=1.7-2.0;
OD260/230=1.3-2.6;
*NC/QC=0.95-3.00;
Fragments should be ≥ 300K, no fragments
below 30k.
Nanopore PCR product libraryPCR product≥ 2 μgOD260/280=1.75~2.0;
OD260/230=1.4~2.6;
*NC/QC=0.95~3.00;
Single band

Sample Requirements

Sample amounts are listed for reference only. Download the Sample Submission Guidelines to learn more. For detailed information, please contact us with your customized requests.


*NC/QC: NanoDrop concentration/Qubit concentration

Platform TypeSample TypeAmount (Qubit®)Purity
Illumina NovaSeq X PlusGenomic DNA≥ 100 ngA260/280=1.8-2.0;
no degradation,
no contamination
Genomic DNA
(PCR free)
≥ 1 μg
Genomic DNA
from FFPE tissue
≥ 300 ngFragments should be ≥ 1500 bp
PacBio Revio DNA HiFi libraryHMW Genomic DNA≥ 3 μgA260/280=1.75-2.0;
A260/230=1.5-2.6;
*NC/QC=1.0-2.2;
Fragments should be ≥ 30 kb
PacBio PCR product libraryPCR product≥ 2 μgOD260/280=1.75~2.0;
OD260/230=1.4~2.6;
*NC/QC=0.95~3.00; Single band
(PacBio library fragments
distributed above 1k)
Nanopore PromethION DNA libraryHMW Genomic DNA≥ 8 μgA260/280=1.75-2.0;
A260/230=1.4-2.6;
*NC/QC=0.95~3.00;
Fragments should be ≥ 30 kb
Nanopore Ultra-long DNA LibraryuHMW Genomic DNA (blood and cells)≥ 30 μgOD260/280=1.7-2.0;
OD260/230=1.3-2.6;
*NC/QC=0.95-3.00;
Fragments should be ≥ 300K, no fragments
below 30k.
Nanopore PCR product libraryPCR product≥ 2 μgOD260/280=1.75~2.0;
OD260/230=1.4~2.6;
*NC/QC=0.95~3.00;
Single band

Sample Requirements

Sample amounts are listed for reference only. Download the Sample Submission Guidelines to learn more. For detailed information, please contact us with your customized requests.


*NC/QC: NanoDrop concentration/Qubit concentration

Platform TypeSample TypeAmount (Qubit®)Purity
Illumina NovaSeq X PlusGenomic DNA≥ 100 ngA260/280=1.8-2.0;
no degradation,
no contamination
Genomic DNA
(PCR free)
≥ 1 μg
Genomic DNA
from FFPE tissue
≥ 300 ngFragments should be ≥ 1500 bp
PacBio Revio DNA HiFi libraryHMW Genomic DNA≥ 3 μgA260/280=1.75-2.0;
A260/230=1.5-2.6;
*NC/QC=1.0-2.2;
Fragments should be ≥ 30 kb
PacBio PCR product libraryPCR product≥ 2 μgOD260/280=1.75~2.0;
OD260/230=1.4~2.6;
*NC/QC=0.95~3.00; Single band
(PacBio library fragments
distributed above 1k)
Nanopore PromethION DNA libraryHMW Genomic DNA≥ 8 μgA260/280=1.75-2.0;
A260/230=1.4-2.6;
*NC/QC=0.95~3.00;
Fragments should be ≥ 30 kb
Nanopore Ultra-long DNA LibraryuHMW Genomic DNA (blood and cells)≥ 30 μgOD260/280=1.7-2.0;
OD260/230=1.3-2.6;
*NC/QC=0.95-3.00;
Fragments should be ≥ 300K, no fragments
below 30k.
Nanopore PCR product libraryPCR product≥ 2 μgOD260/280=1.75~2.0;
OD260/230=1.4~2.6;
*NC/QC=0.95~3.00;
Single band

Sequencing and Analysis

Recommended data outputs and analysis contents displayed are for reference only. For detailed information, please contact us with your customized requests.

Platform TypeIllumina NovaSeq X Plus /NovaSeq6000PacBio RevioNanopore PromethION
Read LengthPaired-end 150 bpAverage > 15 kbAverage > 20 kb
Sequencing DepthRare diseases: 30–50×
Tumor tissues: 50×
Adjacent normal tissues & blood: 30×
Genetic diseases: 10–20×
Tumor tissues: ≥20×
Data qualityGuaranteed ≥ 85% bases with Q30 or higherCondition based
Standard AnalysisData quality control (QC)
Alignment to the reference genome
SNP/InDel/SV/CNV detection
Somatic SNP/InDel/SV/CNV detection for tumor‑normal paired samples
Data quality control (QC)
Sequence alignment
Structural variant (SV) detection
Variant annotation
Advanced AnalysisDisease Advanced Analysis

IBD / Kinship analysis
Variant filtering & ACMG classification
Candidate CNV/SV filtering
Dominant/recessive inheritance modeling
Linkage analysis; ROH detection
Shared‑gene / candidate‑gene screening
Pathway enrichment; gene–disease association
Protein interaction network
HLA typing

Cancer Advanced Analysis

Predisposing gene screening
Mutational spectrum & mutational signatures
Known & novel driver gene identification
SMG & pathway analysis
Somatic Circos visualization
TMB analysis
Driver CNV (GISTIC) & non‑coding driver mutation detection
Tumor purity & ploidy
Intra‑tumor heterogeneity
Fusion gene detection
LOH analysis
HLA typing (tumor/normal)

Personalized / Optional Add‑Ons

CRISPR/Cas9 off‑target analysis
Xenograft (PDX) tumor analysis
Integration site detection
Somatic SNV/INDEL for single tumor
Neoantigen prediction
Tumor evolution (≥3 tumor samples)
gVCF file generation
-

Sequencing and Analysis

Recommended data outputs and analysis contents displayed are for reference only. For detailed information, please contact us with your customized requests.

Platform TypeIllumina NovaSeq X Plus /NovaSeq6000PacBio RevioNanopore PromethION
Read LengthPaired-end 150 bpAverage > 15 kbAverage > 20 kb
Sequencing DepthRare diseases: 30–50×
Tumor tissues: 50×
Adjacent normal tissues & blood: 30×
Genetic diseases: 10–20×
Tumor tissues: ≥20×
Data qualityGuaranteed ≥ 85% bases with Q30 or higherCondition based
Standard AnalysisData quality control (QC)
Alignment to the reference genome
SNP/InDel/SV/CNV detection
Somatic SNP/InDel/SV/CNV detection for tumor‑normal paired samples
Data quality control (QC)
Sequence alignment
Structural variant (SV) detection
Variant annotation
Advanced AnalysisDisease Advanced Analysis

IBD / Kinship analysis
Variant filtering & ACMG classification
Candidate CNV/SV filtering
Dominant/recessive inheritance modeling
Linkage analysis; ROH detection
Shared‑gene / candidate‑gene screening
Pathway enrichment; gene–disease association
Protein interaction network
HLA typing

Cancer Advanced Analysis

Predisposing gene screening
Mutational spectrum & mutational signatures
Known & novel driver gene identification
SMG & pathway analysis
Somatic Circos visualization
TMB analysis
Driver CNV (GISTIC) & non‑coding driver mutation detection
Tumor purity & ploidy
Intra‑tumor heterogeneity
Fusion gene detection
LOH analysis
HLA typing (tumor/normal)

Personalized / Optional Add‑Ons

CRISPR/Cas9 off‑target analysis
Xenograft (PDX) tumor analysis
Integration site detection
Somatic SNV/INDEL for single tumor
Neoantigen prediction
Tumor evolution (≥3 tumor samples)
gVCF file generation
-

Sequencing and Analysis

Recommended data outputs and analysis contents displayed are for reference only. For detailed information, please contact us with your customized requests.

Platform TypeIllumina NovaSeq X Plus /NovaSeq6000PacBio RevioNanopore PromethION
Read LengthPaired-end 150 bpAverage > 15 kbAverage > 20 kb
Sequencing DepthRare diseases: 30–50×
Tumor tissues: 50×
Adjacent normal tissues & blood: 30×
Genetic diseases: 10–20×
Tumor tissues: ≥20×
Data qualityGuaranteed ≥ 85% bases with Q30 or higherCondition based
Standard AnalysisData quality control (QC)
Alignment to the reference genome
SNP/InDel/SV/CNV detection
Somatic SNP/InDel/SV/CNV detection for tumor‑normal paired samples
Data quality control (QC)
Sequence alignment
Structural variant (SV) detection
Variant annotation
Advanced AnalysisDisease Advanced Analysis

IBD / Kinship analysis
Variant filtering & ACMG classification
Candidate CNV/SV filtering
Dominant/recessive inheritance modeling
Linkage analysis; ROH detection
Shared‑gene / candidate‑gene screening
Pathway enrichment; gene–disease association
Protein interaction network
HLA typing

Cancer Advanced Analysis

Predisposing gene screening
Mutational spectrum & mutational signatures
Known & novel driver gene identification
SMG & pathway analysis
Somatic Circos visualization
TMB analysis
Driver CNV (GISTIC) & non‑coding driver mutation detection
Tumor purity & ploidy
Intra‑tumor heterogeneity
Fusion gene detection
LOH analysis
HLA typing (tumor/normal)

Personalized / Optional Add‑Ons

CRISPR/Cas9 off‑target analysis
Xenograft (PDX) tumor analysis
Integration site detection
Somatic SNV/INDEL for single tumor
Neoantigen prediction
Tumor evolution (≥3 tumor samples)
gVCF file generation
-

Sequencing and Analysis

Recommended data outputs and analysis contents displayed are for reference only. For detailed information, please contact us with your customized requests.

Platform TypeIllumina NovaSeq X Plus /NovaSeq6000PacBio RevioNanopore PromethION
Read LengthPaired-end 150 bpAverage > 15 kbAverage > 20 kb
Sequencing DepthRare diseases: 30–50×
Tumor tissues: 50×
Adjacent normal tissues & blood: 30×
Genetic diseases: 10–20×
Tumor tissues: ≥20×
Data qualityGuaranteed ≥ 85% bases with Q30 or higherCondition based
Standard AnalysisData quality control (QC)
Alignment to the reference genome
SNP/InDel/SV/CNV detection
Somatic SNP/InDel/SV/CNV detection for tumor‑normal paired samples
Data quality control (QC)
Sequence alignment
Structural variant (SV) detection
Variant annotation
Advanced AnalysisDisease Advanced Analysis

IBD / Kinship analysis
Variant filtering & ACMG classification
Candidate CNV/SV filtering
Dominant/recessive inheritance modeling
Linkage analysis; ROH detection
Shared‑gene / candidate‑gene screening
Pathway enrichment; gene–disease association
Protein interaction network
HLA typing

Cancer Advanced Analysis

Predisposing gene screening
Mutational spectrum & mutational signatures
Known & novel driver gene identification
SMG & pathway analysis
Somatic Circos visualization
TMB analysis
Driver CNV (GISTIC) & non‑coding driver mutation detection
Tumor purity & ploidy
Intra‑tumor heterogeneity
Fusion gene detection
LOH analysis
HLA typing (tumor/normal)

Personalized / Optional Add‑Ons

CRISPR/Cas9 off‑target analysis
Xenograft (PDX) tumor analysis
Integration site detection
Somatic SNV/INDEL for single tumor
Neoantigen prediction
Tumor evolution (≥3 tumor samples)
gVCF file generation
-

Project Workflow

From sample preparation and library construction through sequencing, data quality control, and bioinformatics analysis, Novogene delivers a streamlined hWGS workflow supported by defined QC checkpoints and standardized procedures to ensure reliable results.

Project Workflow

Project Workflow

From sample preparation and library construction through sequencing, data quality control, and bioinformatics analysis, Novogene delivers a streamlined hWGS workflow supported by defined QC checkpoints and standardized procedures to ensure reliable results.

Project Workflow

Project Workflow

From sample preparation and library construction through sequencing, data quality control, and bioinformatics analysis, Novogene delivers a streamlined hWGS workflow supported by defined QC checkpoints and standardized procedures to ensure reliable results.

Project Workflow

Project Workflow

From sample preparation and library construction through sequencing, data quality control, and bioinformatics analysis, Novogene delivers a streamlined hWGS workflow supported by defined QC checkpoints and standardized procedures to ensure reliable results.

Project Workflow

Specifications

Sample Requirements

Sample amounts are listed for reference only. Download the Sample Submission Guidelines to learn more. For detailed information, please contact us with your customized requests.


*NC/QC: NanoDrop concentration/Qubit concentration

Platform TypeSample TypeAmount (Qubit®)Purity
Illumina NovaSeq X PlusGenomic DNA≥ 100 ngA260/280=1.8-2.0;
no degradation,
no contamination
Genomic DNA
(PCR free)
≥ 1 μg
Genomic DNA
from FFPE tissue
≥ 300 ngFragments should be ≥ 1500 bp
PacBio Revio DNA HiFi libraryHMW Genomic DNA≥ 3 μgA260/280=1.75-2.0;
A260/230=1.5-2.6;
*NC/QC=1.0-2.2;
Fragments should be ≥ 30 kb
PacBio PCR product libraryPCR product≥ 2 μgOD260/280=1.75~2.0;
OD260/230=1.4~2.6;
*NC/QC=0.95~3.00; Single band
(PacBio library fragments
distributed above 1k)
Nanopore PromethION DNA libraryHMW Genomic DNA≥ 8 μgA260/280=1.75-2.0;
A260/230=1.4-2.6;
*NC/QC=0.95~3.00;
Fragments should be ≥ 30 kb
Nanopore Ultra-long DNA LibraryuHMW Genomic DNA (blood and cells)≥ 30 μgOD260/280=1.7-2.0;
OD260/230=1.3-2.6;
*NC/QC=0.95-3.00;
Fragments should be ≥ 300K, no fragments
below 30k.
Nanopore PCR product libraryPCR product≥ 2 μgOD260/280=1.75~2.0;
OD260/230=1.4~2.6;
*NC/QC=0.95~3.00;
Single band

Sample Requirements

Sample amounts are listed for reference only. Download the Sample Submission Guidelines to learn more. For detailed information, please contact us with your customized requests.


*NC/QC: NanoDrop concentration/Qubit concentration

Platform TypeSample TypeAmount (Qubit®)Purity
Illumina NovaSeq X PlusGenomic DNA≥ 100 ngA260/280=1.8-2.0;
no degradation,
no contamination
Genomic DNA
(PCR free)
≥ 1 μg
Genomic DNA
from FFPE tissue
≥ 300 ngFragments should be ≥ 1500 bp
PacBio Revio DNA HiFi libraryHMW Genomic DNA≥ 3 μgA260/280=1.75-2.0;
A260/230=1.5-2.6;
*NC/QC=1.0-2.2;
Fragments should be ≥ 30 kb
PacBio PCR product libraryPCR product≥ 2 μgOD260/280=1.75~2.0;
OD260/230=1.4~2.6;
*NC/QC=0.95~3.00; Single band
(PacBio library fragments
distributed above 1k)
Nanopore PromethION DNA libraryHMW Genomic DNA≥ 8 μgA260/280=1.75-2.0;
A260/230=1.4-2.6;
*NC/QC=0.95~3.00;
Fragments should be ≥ 30 kb
Nanopore Ultra-long DNA LibraryuHMW Genomic DNA (blood and cells)≥ 30 μgOD260/280=1.7-2.0;
OD260/230=1.3-2.6;
*NC/QC=0.95-3.00;
Fragments should be ≥ 300K, no fragments
below 30k.
Nanopore PCR product libraryPCR product≥ 2 μgOD260/280=1.75~2.0;
OD260/230=1.4~2.6;
*NC/QC=0.95~3.00;
Single band

Sample Requirements

Sample amounts are listed for reference only. Download the Sample Submission Guidelines to learn more. For detailed information, please contact us with your customized requests.


*NC/QC: NanoDrop concentration/Qubit concentration

Platform TypeSample TypeAmount (Qubit®)Purity
Illumina NovaSeq X PlusGenomic DNA≥ 100 ngA260/280=1.8-2.0;
no degradation,
no contamination
Genomic DNA
(PCR free)
≥ 1 μg
Genomic DNA
from FFPE tissue
≥ 300 ngFragments should be ≥ 1500 bp
PacBio Revio DNA HiFi libraryHMW Genomic DNA≥ 3 μgA260/280=1.75-2.0;
A260/230=1.5-2.6;
*NC/QC=1.0-2.2;
Fragments should be ≥ 30 kb
PacBio PCR product libraryPCR product≥ 2 μgOD260/280=1.75~2.0;
OD260/230=1.4~2.6;
*NC/QC=0.95~3.00; Single band
(PacBio library fragments
distributed above 1k)
Nanopore PromethION DNA libraryHMW Genomic DNA≥ 8 μgA260/280=1.75-2.0;
A260/230=1.4-2.6;
*NC/QC=0.95~3.00;
Fragments should be ≥ 30 kb
Nanopore Ultra-long DNA LibraryuHMW Genomic DNA (blood and cells)≥ 30 μgOD260/280=1.7-2.0;
OD260/230=1.3-2.6;
*NC/QC=0.95-3.00;
Fragments should be ≥ 300K, no fragments
below 30k.
Nanopore PCR product libraryPCR product≥ 2 μgOD260/280=1.75~2.0;
OD260/230=1.4~2.6;
*NC/QC=0.95~3.00;
Single band

Sample Requirements

Sample amounts are listed for reference only. Download the Sample Submission Guidelines to learn more. For detailed information, please contact us with your customized requests.


*NC/QC: NanoDrop concentration/Qubit concentration

Platform TypeSample TypeAmount (Qubit®)Purity
Illumina NovaSeq X PlusGenomic DNA≥ 100 ngA260/280=1.8-2.0;
no degradation,
no contamination
Genomic DNA
(PCR free)
≥ 1 μg
Genomic DNA
from FFPE tissue
≥ 300 ngFragments should be ≥ 1500 bp
PacBio Revio DNA HiFi libraryHMW Genomic DNA≥ 3 μgA260/280=1.75-2.0;
A260/230=1.5-2.6;
*NC/QC=1.0-2.2;
Fragments should be ≥ 30 kb
PacBio PCR product libraryPCR product≥ 2 μgOD260/280=1.75~2.0;
OD260/230=1.4~2.6;
*NC/QC=0.95~3.00; Single band
(PacBio library fragments
distributed above 1k)
Nanopore PromethION DNA libraryHMW Genomic DNA≥ 8 μgA260/280=1.75-2.0;
A260/230=1.4-2.6;
*NC/QC=0.95~3.00;
Fragments should be ≥ 30 kb
Nanopore Ultra-long DNA LibraryuHMW Genomic DNA (blood and cells)≥ 30 μgOD260/280=1.7-2.0;
OD260/230=1.3-2.6;
*NC/QC=0.95-3.00;
Fragments should be ≥ 300K, no fragments
below 30k.
Nanopore PCR product libraryPCR product≥ 2 μgOD260/280=1.75~2.0;
OD260/230=1.4~2.6;
*NC/QC=0.95~3.00;
Single band

Sequencing and Analysis

Recommended data outputs and analysis contents displayed are for reference only. For detailed information, please contact us with your customized requests.

Platform TypeIllumina NovaSeq X Plus /NovaSeq6000PacBio RevioNanopore PromethION
Read LengthPaired-end 150 bpAverage > 15 kbAverage > 20 kb
Sequencing DepthRare diseases: 30–50×
Tumor tissues: 50×
Adjacent normal tissues & blood: 30×
Genetic diseases: 10–20×
Tumor tissues: ≥20×
Data qualityGuaranteed ≥ 85% bases with Q30 or higherCondition based
Standard AnalysisData quality control (QC)
Alignment to the reference genome
SNP/InDel/SV/CNV detection
Somatic SNP/InDel/SV/CNV detection for tumor‑normal paired samples
Data quality control (QC)
Sequence alignment
Structural variant (SV) detection
Variant annotation
Advanced AnalysisDisease Advanced Analysis

IBD / Kinship analysis
Variant filtering & ACMG classification
Candidate CNV/SV filtering
Dominant/recessive inheritance modeling
Linkage analysis; ROH detection
Shared‑gene / candidate‑gene screening
Pathway enrichment; gene–disease association
Protein interaction network
HLA typing

Cancer Advanced Analysis

Predisposing gene screening
Mutational spectrum & mutational signatures
Known & novel driver gene identification
SMG & pathway analysis
Somatic Circos visualization
TMB analysis
Driver CNV (GISTIC) & non‑coding driver mutation detection
Tumor purity & ploidy
Intra‑tumor heterogeneity
Fusion gene detection
LOH analysis
HLA typing (tumor/normal)

Personalized / Optional Add‑Ons

CRISPR/Cas9 off‑target analysis
Xenograft (PDX) tumor analysis
Integration site detection
Somatic SNV/INDEL for single tumor
Neoantigen prediction
Tumor evolution (≥3 tumor samples)
gVCF file generation
-

Sequencing and Analysis

Recommended data outputs and analysis contents displayed are for reference only. For detailed information, please contact us with your customized requests.

Platform TypeIllumina NovaSeq X Plus /NovaSeq6000PacBio RevioNanopore PromethION
Read LengthPaired-end 150 bpAverage > 15 kbAverage > 20 kb
Sequencing DepthRare diseases: 30–50×
Tumor tissues: 50×
Adjacent normal tissues & blood: 30×
Genetic diseases: 10–20×
Tumor tissues: ≥20×
Data qualityGuaranteed ≥ 85% bases with Q30 or higherCondition based
Standard AnalysisData quality control (QC)
Alignment to the reference genome
SNP/InDel/SV/CNV detection
Somatic SNP/InDel/SV/CNV detection for tumor‑normal paired samples
Data quality control (QC)
Sequence alignment
Structural variant (SV) detection
Variant annotation
Advanced AnalysisDisease Advanced Analysis

IBD / Kinship analysis
Variant filtering & ACMG classification
Candidate CNV/SV filtering
Dominant/recessive inheritance modeling
Linkage analysis; ROH detection
Shared‑gene / candidate‑gene screening
Pathway enrichment; gene–disease association
Protein interaction network
HLA typing

Cancer Advanced Analysis

Predisposing gene screening
Mutational spectrum & mutational signatures
Known & novel driver gene identification
SMG & pathway analysis
Somatic Circos visualization
TMB analysis
Driver CNV (GISTIC) & non‑coding driver mutation detection
Tumor purity & ploidy
Intra‑tumor heterogeneity
Fusion gene detection
LOH analysis
HLA typing (tumor/normal)

Personalized / Optional Add‑Ons

CRISPR/Cas9 off‑target analysis
Xenograft (PDX) tumor analysis
Integration site detection
Somatic SNV/INDEL for single tumor
Neoantigen prediction
Tumor evolution (≥3 tumor samples)
gVCF file generation
-

Sequencing and Analysis

Recommended data outputs and analysis contents displayed are for reference only. For detailed information, please contact us with your customized requests.

Platform TypeIllumina NovaSeq X Plus /NovaSeq6000PacBio RevioNanopore PromethION
Read LengthPaired-end 150 bpAverage > 15 kbAverage > 20 kb
Sequencing DepthRare diseases: 30–50×
Tumor tissues: 50×
Adjacent normal tissues & blood: 30×
Genetic diseases: 10–20×
Tumor tissues: ≥20×
Data qualityGuaranteed ≥ 85% bases with Q30 or higherCondition based
Standard AnalysisData quality control (QC)
Alignment to the reference genome
SNP/InDel/SV/CNV detection
Somatic SNP/InDel/SV/CNV detection for tumor‑normal paired samples
Data quality control (QC)
Sequence alignment
Structural variant (SV) detection
Variant annotation
Advanced AnalysisDisease Advanced Analysis

IBD / Kinship analysis
Variant filtering & ACMG classification
Candidate CNV/SV filtering
Dominant/recessive inheritance modeling
Linkage analysis; ROH detection
Shared‑gene / candidate‑gene screening
Pathway enrichment; gene–disease association
Protein interaction network
HLA typing

Cancer Advanced Analysis

Predisposing gene screening
Mutational spectrum & mutational signatures
Known & novel driver gene identification
SMG & pathway analysis
Somatic Circos visualization
TMB analysis
Driver CNV (GISTIC) & non‑coding driver mutation detection
Tumor purity & ploidy
Intra‑tumor heterogeneity
Fusion gene detection
LOH analysis
HLA typing (tumor/normal)

Personalized / Optional Add‑Ons

CRISPR/Cas9 off‑target analysis
Xenograft (PDX) tumor analysis
Integration site detection
Somatic SNV/INDEL for single tumor
Neoantigen prediction
Tumor evolution (≥3 tumor samples)
gVCF file generation
-

Sequencing and Analysis

Recommended data outputs and analysis contents displayed are for reference only. For detailed information, please contact us with your customized requests.

Platform TypeIllumina NovaSeq X Plus /NovaSeq6000PacBio RevioNanopore PromethION
Read LengthPaired-end 150 bpAverage > 15 kbAverage > 20 kb
Sequencing DepthRare diseases: 30–50×
Tumor tissues: 50×
Adjacent normal tissues & blood: 30×
Genetic diseases: 10–20×
Tumor tissues: ≥20×
Data qualityGuaranteed ≥ 85% bases with Q30 or higherCondition based
Standard AnalysisData quality control (QC)
Alignment to the reference genome
SNP/InDel/SV/CNV detection
Somatic SNP/InDel/SV/CNV detection for tumor‑normal paired samples
Data quality control (QC)
Sequence alignment
Structural variant (SV) detection
Variant annotation
Advanced AnalysisDisease Advanced Analysis

IBD / Kinship analysis
Variant filtering & ACMG classification
Candidate CNV/SV filtering
Dominant/recessive inheritance modeling
Linkage analysis; ROH detection
Shared‑gene / candidate‑gene screening
Pathway enrichment; gene–disease association
Protein interaction network
HLA typing

Cancer Advanced Analysis

Predisposing gene screening
Mutational spectrum & mutational signatures
Known & novel driver gene identification
SMG & pathway analysis
Somatic Circos visualization
TMB analysis
Driver CNV (GISTIC) & non‑coding driver mutation detection
Tumor purity & ploidy
Intra‑tumor heterogeneity
Fusion gene detection
LOH analysis
HLA typing (tumor/normal)

Personalized / Optional Add‑Ons

CRISPR/Cas9 off‑target analysis
Xenograft (PDX) tumor analysis
Integration site detection
Somatic SNV/INDEL for single tumor
Neoantigen prediction
Tumor evolution (≥3 tumor samples)
gVCF file generation
-

Project Workflow

From sample preparation and library construction through sequencing, data quality control, and bioinformatics analysis, Novogene delivers a streamlined hWGS workflow supported by defined QC checkpoints and standardized procedures to ensure reliable results.

Project Workflow

Project Workflow

From sample preparation and library construction through sequencing, data quality control, and bioinformatics analysis, Novogene delivers a streamlined hWGS workflow supported by defined QC checkpoints and standardized procedures to ensure reliable results.

Project Workflow

Project Workflow

From sample preparation and library construction through sequencing, data quality control, and bioinformatics analysis, Novogene delivers a streamlined hWGS workflow supported by defined QC checkpoints and standardized procedures to ensure reliable results.

Project Workflow

Project Workflow

From sample preparation and library construction through sequencing, data quality control, and bioinformatics analysis, Novogene delivers a streamlined hWGS workflow supported by defined QC checkpoints and standardized procedures to ensure reliable results.

Project Workflow

Demo Results

Image
Image
1/1
Sequencing Depth Distribution

Left panel: distribution of sequencing depth across all bases per sample (x: depth, y: fraction of bases at each depth). Right panel: cumulative depth distribution (x: cumulative depth, y: fraction of bases at depth ≥ the specified value).

Image
Image
1/1
Chromosome Level Average Depth and Coverage

Bar chart shows the average sequencing depth per chromosome (left y axis).

Line plot shows coverage (fraction of bases covered) per chromosome (right y axis).

The x axis represents chromosomes.

Image
Image
1/1
SNP Distribution

Left panel: Number of SNPs located in different genomic regions (pie chart).

Right panel: Classification of SNP types within coding regions (pie chart).

Image
Image
1/1
Circos Plot

Genome wide visualization of genomic variants displayed using a Circos plot.

Image
Image
1/1
Somatic Structural Variant Counts

Number of somatic SV types detected in each sample.

The x axis represents samples, and the y axis represents the count of each SV category.

Image
Image
1/1
Predisposing Gene Landscape

Heatmap of mutations in susceptibility genes. X: samples; Y: genes; top bar: mutations per sample; right bar: mutations per gene. Shows top 30 genes; samples with no mutations hidden by default.

Image
Image
1/1
Mutational Signatures

P1: signature profiles—mutation types (x) vs. contributions (y). P2: signature proportions per sample. P3: cosine-similarity clustering vs. 30 COSMIC signatures (darker = closer match).

Image
Image
1/1
Sequencing Depth Distribution

Left panel: distribution of sequencing depth across all bases per sample (x: depth, y: fraction of bases at each depth). Right panel: cumulative depth distribution (x: cumulative depth, y: fraction of bases at depth ≥ the specified value).

Image
Image
1/1
Chromosome Level Average Depth and Coverage

Bar chart shows the average sequencing depth per chromosome (left y axis).

Line plot shows coverage (fraction of bases covered) per chromosome (right y axis).

The x axis represents chromosomes.

Image
Image
1/1
SNP Distribution

Left panel: Number of SNPs located in different genomic regions (pie chart).

Right panel: Classification of SNP types within coding regions (pie chart).

Image
Image
1/1
Circos Plot

Genome wide visualization of genomic variants displayed using a Circos plot.

Image
Image
1/1
Somatic Structural Variant Counts

Number of somatic SV types detected in each sample.

The x axis represents samples, and the y axis represents the count of each SV category.

Image
Image
1/1
Predisposing Gene Landscape

Heatmap of mutations in susceptibility genes. X: samples; Y: genes; top bar: mutations per sample; right bar: mutations per gene. Shows top 30 genes; samples with no mutations hidden by default.

Image
Image
1/1
Mutational Signatures

P1: signature profiles—mutation types (x) vs. contributions (y). P2: signature proportions per sample. P3: cosine-similarity clustering vs. 30 COSMIC signatures (darker = closer match).

Demo Results

Image
Image
1/1
Sequencing Depth Distribution

Left panel: distribution of sequencing depth across all bases per sample (x: depth, y: fraction of bases at each depth). Right panel: cumulative depth distribution (x: cumulative depth, y: fraction of bases at depth ≥ the specified value).

Image
Image
1/1
Chromosome Level Average Depth and Coverage

Bar chart shows the average sequencing depth per chromosome (left y axis).

Line plot shows coverage (fraction of bases covered) per chromosome (right y axis).

The x axis represents chromosomes.

Image
Image
1/1
SNP Distribution

Left panel: Number of SNPs located in different genomic regions (pie chart).

Right panel: Classification of SNP types within coding regions (pie chart).

Image
Image
1/1
Circos Plot

Genome wide visualization of genomic variants displayed using a Circos plot.

Image
Image
1/1
Somatic Structural Variant Counts

Number of somatic SV types detected in each sample.

The x axis represents samples, and the y axis represents the count of each SV category.

Image
Image
1/1
Predisposing Gene Landscape

Heatmap of mutations in susceptibility genes. X: samples; Y: genes; top bar: mutations per sample; right bar: mutations per gene. Shows top 30 genes; samples with no mutations hidden by default.

Image
Image
1/1
Mutational Signatures

P1: signature profiles—mutation types (x) vs. contributions (y). P2: signature proportions per sample. P3: cosine-similarity clustering vs. 30 COSMIC signatures (darker = closer match).

Image
Image
1/1
Sequencing Depth Distribution

Left panel: distribution of sequencing depth across all bases per sample (x: depth, y: fraction of bases at each depth). Right panel: cumulative depth distribution (x: cumulative depth, y: fraction of bases at depth ≥ the specified value).

Image
Image
1/1
Chromosome Level Average Depth and Coverage

Bar chart shows the average sequencing depth per chromosome (left y axis).

Line plot shows coverage (fraction of bases covered) per chromosome (right y axis).

The x axis represents chromosomes.

Image
Image
1/1
SNP Distribution

Left panel: Number of SNPs located in different genomic regions (pie chart).

Right panel: Classification of SNP types within coding regions (pie chart).

Image
Image
1/1
Circos Plot

Genome wide visualization of genomic variants displayed using a Circos plot.

Image
Image
1/1
Somatic Structural Variant Counts

Number of somatic SV types detected in each sample.

The x axis represents samples, and the y axis represents the count of each SV category.

Image
Image
1/1
Predisposing Gene Landscape

Heatmap of mutations in susceptibility genes. X: samples; Y: genes; top bar: mutations per sample; right bar: mutations per gene. Shows top 30 genes; samples with no mutations hidden by default.

Image
Image
1/1
Mutational Signatures

P1: signature profiles—mutation types (x) vs. contributions (y). P2: signature proportions per sample. P3: cosine-similarity clustering vs. 30 COSMIC signatures (darker = closer match).

Frequently Asked Questions

What sample types are accepted?

•Illumina: Genomic DNA ≥100 ng (A260/280 1.8–2.0); PCR free ≥1 µg; FFPE ≥300 ng with fragments ≥1,500 bp.

•PacBio: ≥3 µg high molecular weight DNA, fragments ≥30 kb.

•Nanopore: ≥8 µg HMW DNA or ≥30 µg ultra HMW DNA, fragments ≥30–300 kb.

What sequencing depth should I choose?

Do you offer short read and long read WGS?

What files do I receive?

How are difficult genomic regions handled?

What is the turnaround time?

How is data delivered securely?

More Services

Shotgun Metagenomics Sequencing
(Shotgun Metagenomics Sequencing)
Shotgun Metagenomics Sequencing
(Shotgun Metagenomics Sequencing)
Plant and Animal Whole Genome Sequencing
(Plant and Animal Whole Genome Sequencing)
Plant and Animal Whole Genome Sequencing
(Plant and Animal Whole Genome Sequencing)
Microbial Whole Genome Sequencing
(Microbial Whole Genome Sequencing)
Microbial Whole Genome Sequencing
(Microbial Whole Genome Sequencing)
Whole Exome Sequencing
(Whole Exome Sequencing)
Whole Exome Sequencing
(Whole Exome Sequencing)
Whole Genome Bisulfite Sequencing (WGBS)
(Whole Genome Bisulfite Sequencing (WGBS))
Whole Genome Bisulfite Sequencing (WGBS)
(Whole Genome Bisulfite Sequencing (WGBS))

More Services

Shotgun Metagenomics Sequencing
(Shotgun Metagenomics Sequencing)
Shotgun Metagenomics Sequencing
(Shotgun Metagenomics Sequencing)
Plant and Animal Whole Genome Sequencing
(Plant and Animal Whole Genome Sequencing)
Plant and Animal Whole Genome Sequencing
(Plant and Animal Whole Genome Sequencing)
Microbial Whole Genome Sequencing
(Microbial Whole Genome Sequencing)
Microbial Whole Genome Sequencing
(Microbial Whole Genome Sequencing)
Whole Exome Sequencing
(Whole Exome Sequencing)
Whole Exome Sequencing
(Whole Exome Sequencing)
Whole Genome Bisulfite Sequencing (WGBS)
(Whole Genome Bisulfite Sequencing (WGBS))
Whole Genome Bisulfite Sequencing (WGBS)
(Whole Genome Bisulfite Sequencing (WGBS))
Background
Background

Ready to Start Your Project?

Our platform offers tailored solutions for

your unique experimental needs, ensuring a seamless experience from project design to data delivery.


Your Privacy ChoicesPrivacy PolicyCookie PolicyCareers