
• Cart
    • Quote
    • Inquiry
    • Cart
    • Quote
    • Inquiry
Novogene
  • Novogene
  • Genomics
    • Human Whole Genome Sequencing
    • Whole Exome Sequencing
    • Plant and Animal Whole Genome Sequencing
    • Plant and Animal De Novo Sequencing
    • Microbial Whole Genome Sequencing
    • Microbial De Novo Sequencing

    Metagenomics

    • Shotgun Metagenomics Sequencing
    • Amplicon Sequencing

    Transcriptomics

    • mRNA Sequencing
    • Swift & Express mRNA Sequencing New!
    • Full-Length Transcriptome Sequencing
    • Prokaryotic RNA Sequencing
    • Metatranscriptome Sequencing
    • Total RNA Sequencing
    • Small RNA Sequencing (sRNA‑seq)
    • Whole Transcriptome Sequencing

    Single Cell & Spatial Omics

    • 10x Single Cell Gene Expression
    • Illumina PIP-seq Single Cell 3’ RNA Sequencing New!
    • Spatial Transcriptomics Sequencing New!

    Epigenomics

    • Whole Genome Bisulfite Sequencing (WGBS)
    • Enzymatic Methylation Sequencing
    • Directed Methylation Sequencing (DM-Seq) New!
    • RNA Immunoprecipitation Sequencing (RIP-seq)
    • Chromatin Immunoprecipitation Sequencing (ChIP-seq)
    • Cleavage Under Targets & Tagmentation (CUT&Tag) New!
    • Assay for Transposase-Accessible Chromatin with Sequencing (ATAC-seq)
    • Reduced Representation Bisulfite Sequencing (RRBS)

    Proteomics

    • Quantitative Proteomics New!
    • PTM Proteomics New!
    • Olink Proteomics New!

    Metabolomics

    • Untargeted Metabolomics

    Premade Library

    • Sequencing Only on Illumina Sequencer
    • Sequencing Only on Ultima Sequencer
  • PromotionsPromotions
    • Platforms
    • Service & Support
    • Automated Delivery Platform (Falcon)
    • Bioinformatics Analysis Tool (NovoMagic)
    • Customer Service System (CSS)
    • Case Study
    • Blog
    • Webinar
    • Brochure
    • Cancer Research
    • Immuno-oncology
    • Agrigenomics
    • Environment
    • Food Science
    • Human Microbiome
    • Plant and Animal Microbiome
    • Drug Discovery and Development
    • Rare and Complex Diseases
    • About Us
    • Our Locations
    • News & Events
    • Careers
  • Contact UsContact Us
    • mRNA Sequencing
    • Illumina Lane Sequencing

ServicesServices menu

CompanyCompany menu

Contact UsContact Us menu

Service SupportService Support menu

Services
mRNA SequencingSwift & Express mRNA SequencingTotal RNA SequencingHuman Whole Genome SequencingWhole Exome Sequencing10x Single Cell Gene ExpressionIllumina PIP-seq Single Cell 3’ RNA SequencingSpatial Transcriptomics SequencingWhole Genome Bisulfite Sequencing (WGBS)Quantitative ProteomicsUntargeted MetabolomicsShotgun Metagenomics SequencingMetatranscriptome SequencingSequencing Only on Illumina SequencerSequencing Only on Ultima SequencerFull-Length Transcriptome SequencingChromatin Immunoprecipitation Sequencing (ChIP-seq)
Company
About UsOur LocationsNews & EventsCareers
Contact Us
Contact Us
Service Support
Automated Delivery Platform (Falcon)Bioinformatics Analysis Tool (NovoMagic)Customer Service System (CSS)
LinkedInLinkedIn hoverYouTubeYouTube hoverXX hoverMetaMeta hoverInstagramInstagram hover
Copyright © 2026 Novogene Corporation Inc. All rights reserved. For Research Use Only.
    • Cart
    • Quote
    • Inquiry
    • Cart
    • Quote
    • Inquiry
Novogene
  • Novogene
  • Genomics
    • Human Whole Genome Sequencing
    • Whole Exome Sequencing
    • Plant and Animal Whole Genome Sequencing
    • Plant and Animal De Novo Sequencing
    • Microbial Whole Genome Sequencing
    • Microbial De Novo Sequencing

    Metagenomics

    • Shotgun Metagenomics Sequencing
    • Amplicon Sequencing

    Transcriptomics

    • mRNA Sequencing
    • Swift & Express mRNA Sequencing New!
    • Full-Length Transcriptome Sequencing
    • Prokaryotic RNA Sequencing
    • Metatranscriptome Sequencing
    • Total RNA Sequencing
    • Small RNA Sequencing (sRNA‑seq)
    • Whole Transcriptome Sequencing

    Single Cell & Spatial Omics

    • 10x Single Cell Gene Expression
    • Illumina PIP-seq Single Cell 3’ RNA Sequencing New!
    • Spatial Transcriptomics Sequencing New!

    Epigenomics

    • Whole Genome Bisulfite Sequencing (WGBS)
    • Enzymatic Methylation Sequencing
    • Directed Methylation Sequencing (DM-Seq) New!
    • RNA Immunoprecipitation Sequencing (RIP-seq)
    • Chromatin Immunoprecipitation Sequencing (ChIP-seq)
    • Cleavage Under Targets & Tagmentation (CUT&Tag) New!
    • Assay for Transposase-Accessible Chromatin with Sequencing (ATAC-seq)
    • Reduced Representation Bisulfite Sequencing (RRBS)

    Proteomics

    • Quantitative Proteomics New!
    • PTM Proteomics New!
    • Olink Proteomics New!

    Metabolomics

    • Untargeted Metabolomics

    Premade Library

    • Sequencing Only on Illumina Sequencer
    • Sequencing Only on Ultima Sequencer
  • PromotionsPromotions
    • Platforms
    • Service & Support
    • Automated Delivery Platform (Falcon)
    • Bioinformatics Analysis Tool (NovoMagic)
    • Customer Service System (CSS)
    • Case Study
    • Blog
    • Webinar
    • Brochure
    • Cancer Research
    • Immuno-oncology
    • Agrigenomics
    • Environment
    • Food Science
    • Human Microbiome
    • Plant and Animal Microbiome
    • Drug Discovery and Development
    • Rare and Complex Diseases
    • About Us
    • Our Locations
    • News & Events
    • Careers
  • Contact UsContact Us
    • mRNA Sequencing
    • Illumina Lane Sequencing

ServicesServices menu

CompanyCompany menu

Contact UsContact Us menu

Service SupportService Support menu

Services
mRNA SequencingSwift & Express mRNA SequencingTotal RNA SequencingHuman Whole Genome SequencingWhole Exome Sequencing10x Single Cell Gene ExpressionIllumina PIP-seq Single Cell 3’ RNA SequencingSpatial Transcriptomics SequencingWhole Genome Bisulfite Sequencing (WGBS)Quantitative ProteomicsUntargeted MetabolomicsShotgun Metagenomics SequencingMetatranscriptome SequencingSequencing Only on Illumina SequencerSequencing Only on Ultima SequencerFull-Length Transcriptome SequencingChromatin Immunoprecipitation Sequencing (ChIP-seq)
Company
About UsOur LocationsNews & EventsCareers
Contact Us
Contact Us
Service Support
Automated Delivery Platform (Falcon)Bioinformatics Analysis Tool (NovoMagic)Customer Service System (CSS)
LinkedInLinkedIn hoverYouTubeYouTube hoverXX hoverMetaMeta hoverInstagramInstagram hover
Copyright © 2026 Novogene Corporation Inc. All rights reserved. For Research Use Only.
banner laptop bg
banner mobile bg

Spatial Transcriptomics Sequencing

Combines next-generation sequencing with spatial information to uncover cellular heterogeneity and tissue architecture
OverviewOverview
BenefitsBenefits
ApplicationsApplications
SpecificationsSpecifications
ResourcesResources

Spatial transcriptomics enables the comprehensive characterization of gene expression within its native tissue context, providing unprecedented insights into cellular organization, tissue architecture, and cell–cell interactions.


Novogene offers end-to-end spatial transcriptomics solutions, from experimental design and sample processing to sequencing and advanced bioinformatics analysis. Powered by leading platforms including 10x Genomics Visium and STOmics Stereo-seq, our services deliver high-resolution spatial profiling to support discoveries in oncology, immunology, neuroscience, developmental biology, and precision medicine. Backed by extensive multi-omics expertise and dedicated scientific support, Novogene helps researchers transform complex spatial data into meaningful biological insights.

Spatial Transcriptomics Platforms at Novogene

10x Genomics Visium HD
High-resolution spatial gene expression profiling
Compatible with FFPE, fresh frozen, and fixed frozen samples
Improved gene detection sensitivity across spatial domains
10x Genomics Visium HD
High-resolution spatial gene expression profiling
Compatible with FFPE, fresh frozen, and fixed frozen samples
Improved gene detection sensitivity across spatial domains
10x Genomics Visium HD 3’
Broad eukaryotic species support
Optimized for poly-A transcript detection
Ideal for scalable spatial transcriptomics across diverse species
10x Genomics Visium HD 3’
Broad eukaryotic species support
Optimized for poly-A transcript detection
Ideal for scalable spatial transcriptomics across diverse species
STOmics Stereo-seq OMNI FFPE
Ultra-high throughput spatial transcriptomics
Suitable for large tissue sections
Massive spatial capture area for whole-tissue profiling
STOmics Stereo-seq OMNI FFPE
Ultra-high throughput spatial transcriptomics
Suitable for large tissue sections
Massive spatial capture area for whole-tissue profiling

Spatial Transcriptomics Platforms at Novogene

10x Genomics Visium HD
High-resolution spatial gene expression profiling
Compatible with FFPE, fresh frozen, and fixed frozen samples
Improved gene detection sensitivity across spatial domains
10x Genomics Visium HD
High-resolution spatial gene expression profiling
Compatible with FFPE, fresh frozen, and fixed frozen samples
Improved gene detection sensitivity across spatial domains
10x Genomics Visium HD 3’
Broad eukaryotic species support
Optimized for poly-A transcript detection
Ideal for scalable spatial transcriptomics across diverse species
10x Genomics Visium HD 3’
Broad eukaryotic species support
Optimized for poly-A transcript detection
Ideal for scalable spatial transcriptomics across diverse species
STOmics Stereo-seq OMNI FFPE
Ultra-high throughput spatial transcriptomics
Suitable for large tissue sections
Massive spatial capture area for whole-tissue profiling
STOmics Stereo-seq OMNI FFPE
Ultra-high throughput spatial transcriptomics
Suitable for large tissue sections
Massive spatial capture area for whole-tissue profiling
bg
bg

Benefits of Novogene’s Spatial Transcriptomics Service

PhD-Level Expert TeamPhD-Level Expert Team
PhD-Level Expert Team

Novogene’s PhD-level scientists provide expertise in experimental design and bioinformatics. With 20+ years of pathology and tissue research experience, our team ensures reliable sample processing and accurate spatial data analysis.

PhD-Level Expert Team

Novogene’s PhD-level scientists provide expertise in experimental design and bioinformatics. With 20+ years of pathology and tissue research experience, our team ensures reliable sample processing and accurate spatial data analysis.

Advanced Technology PlatformsAdvanced Technology Platforms
Advanced Technology Platforms

We offer advanced spatial transcriptomics solutions, including Visium HD, Visium HD 3’, and Stereo-seq. State-of-the-art imaging and tissue-processing systems ensure high-quality spatial profiling and analysis.

Advanced Technology Platforms

We offer advanced spatial transcriptomics solutions, including Visium HD, Visium HD 3’, and Stereo-seq. State-of-the-art imaging and tissue-processing systems ensure high-quality spatial profiling and analysis.

Proven Experience Across Diverse ProjectsProven Experience Across Diverse Projects
Proven Experience Across Diverse Projects

Novogene has completed over 4,000 spatial and transcriptomics projects across 50+ species and 100+ tissue types, supporting diverse research areas with robust workflows and reproducible results.

Proven Experience Across Diverse Projects

Novogene has completed over 4,000 spatial and transcriptomics projects across 50+ species and 100+ tissue types, supporting diverse research areas with robust workflows and reproducible results.

High-Impact Scientific OutcomesHigh-Impact Scientific Outcomes
High-Impact Scientific Outcomes

Novogene has contributed to 350+ publications in leading journals, including Nature and Cell. Our high-quality data and analytical expertise support impactful discoveries and successful publication outcomes.

High-Impact Scientific Outcomes

Novogene has contributed to 350+ publications in leading journals, including Nature and Cell. Our high-quality data and analytical expertise support impactful discoveries and successful publication outcomes.

bg
bg

Benefits of Novogene’s Spatial Transcriptomics Service

PhD-Level Expert TeamPhD-Level Expert Team
PhD-Level Expert Team

Novogene’s PhD-level scientists provide expertise in experimental design and bioinformatics. With 20+ years of pathology and tissue research experience, our team ensures reliable sample processing and accurate spatial data analysis.

PhD-Level Expert Team

Novogene’s PhD-level scientists provide expertise in experimental design and bioinformatics. With 20+ years of pathology and tissue research experience, our team ensures reliable sample processing and accurate spatial data analysis.

Advanced Technology PlatformsAdvanced Technology Platforms
Advanced Technology Platforms

We offer advanced spatial transcriptomics solutions, including Visium HD, Visium HD 3’, and Stereo-seq. State-of-the-art imaging and tissue-processing systems ensure high-quality spatial profiling and analysis.

Advanced Technology Platforms

We offer advanced spatial transcriptomics solutions, including Visium HD, Visium HD 3’, and Stereo-seq. State-of-the-art imaging and tissue-processing systems ensure high-quality spatial profiling and analysis.

Proven Experience Across Diverse ProjectsProven Experience Across Diverse Projects
Proven Experience Across Diverse Projects

Novogene has completed over 4,000 spatial and transcriptomics projects across 50+ species and 100+ tissue types, supporting diverse research areas with robust workflows and reproducible results.

Proven Experience Across Diverse Projects

Novogene has completed over 4,000 spatial and transcriptomics projects across 50+ species and 100+ tissue types, supporting diverse research areas with robust workflows and reproducible results.

High-Impact Scientific OutcomesHigh-Impact Scientific Outcomes
High-Impact Scientific Outcomes

Novogene has contributed to 350+ publications in leading journals, including Nature and Cell. Our high-quality data and analytical expertise support impactful discoveries and successful publication outcomes.

High-Impact Scientific Outcomes

Novogene has contributed to 350+ publications in leading journals, including Nature and Cell. Our high-quality data and analytical expertise support impactful discoveries and successful publication outcomes.

Applications of Spatial Transcriptomics

Spatial transcriptomics has been assisting researchers in the following research areas, including:

Cancer Research

Explore the spatial architecture of tumors by mapping gene expression directly within tissue sections. This approach helps uncover interactions between cancer, immune, and stromal cells that influence disease progression and treatment outcomes.

Cancer Research

Explore the spatial architecture of tumors by mapping gene expression directly within tissue sections. This approach helps uncover interactions between cancer, immune, and stromal cells that influence disease progression and treatment outcomes.

Developmental Biology

Gain insight into how tissues and organs form by linking gene activity to precise anatomical locations. Spatially resolved data provide a powerful framework for studying development, differentiation, and morphogenesis.

Developmental Biology

Gain insight into how tissues and organs form by linking gene activity to precise anatomical locations. Spatially resolved data provide a powerful framework for studying development, differentiation, and morphogenesis.

Neuroscience

Investigate molecular patterns across brain regions and neural circuits while preserving tissue context. Spatial analysis enables a deeper understanding of brain organization, function, and neurological disorders.

Neuroscience

Investigate molecular patterns across brain regions and neural circuits while preserving tissue context. Spatial analysis enables a deeper understanding of brain organization, function, and neurological disorders.

Infectious Disease & Immune Response

Characterize where immune cells reside, interact, and become activated during infection or inflammation. These spatial insights help reveal mechanisms of host defense, tissue immunity, and disease pathogenesis.

Infectious Disease & Immune Response

Characterize where immune cells reside, interact, and become activated during infection or inflammation. These spatial insights help reveal mechanisms of host defense, tissue immunity, and disease pathogenesis.

Applications of Spatial Transcriptomics

Spatial transcriptomics has been assisting researchers in the following research areas, including:

Cancer Research

Explore the spatial architecture of tumors by mapping gene expression directly within tissue sections. This approach helps uncover interactions between cancer, immune, and stromal cells that influence disease progression and treatment outcomes.

Cancer Research

Explore the spatial architecture of tumors by mapping gene expression directly within tissue sections. This approach helps uncover interactions between cancer, immune, and stromal cells that influence disease progression and treatment outcomes.

Developmental Biology

Gain insight into how tissues and organs form by linking gene activity to precise anatomical locations. Spatially resolved data provide a powerful framework for studying development, differentiation, and morphogenesis.

Developmental Biology

Gain insight into how tissues and organs form by linking gene activity to precise anatomical locations. Spatially resolved data provide a powerful framework for studying development, differentiation, and morphogenesis.

Neuroscience

Investigate molecular patterns across brain regions and neural circuits while preserving tissue context. Spatial analysis enables a deeper understanding of brain organization, function, and neurological disorders.

Neuroscience

Investigate molecular patterns across brain regions and neural circuits while preserving tissue context. Spatial analysis enables a deeper understanding of brain organization, function, and neurological disorders.

Infectious Disease & Immune Response

Characterize where immune cells reside, interact, and become activated during infection or inflammation. These spatial insights help reveal mechanisms of host defense, tissue immunity, and disease pathogenesis.

Infectious Disease & Immune Response

Characterize where immune cells reside, interact, and become activated during infection or inflammation. These spatial insights help reveal mechanisms of host defense, tissue immunity, and disease pathogenesis.

Specifications

Sample Requirements

Sample amounts are listed for reference only. Download the Sample Submission Guidelines to learn more. For detailed information, please contact us with your customized requests.


*FFPE glass slides must be positive charged glass slides.

ServiceSample Input Type
FFPE BlocksFFPE SlidesFF OCT Blocks
10x VIsium HD 3’❌❌✅
10x VIsium HD✅✅✅
Stereo-Seq OMNI FFPE✅✅❌
Sample Requirement1 block, placed in a plastic dehydration box• RNA QC: 5-10 FFPE sections (10μm thickness), placed in a tube;
• Library construction: 2-4 FFPE tissue sections (5μm thickness), placed on slides and stored in slide mailing boxes
Tissue thickness >1mm, area <6.5×6.5mm
Storage Conditions4℃ storage after embedding, protected from lightDry and sealed, 4℃ storage for no more than 30 days-80℃ storage, mark the cutting surface on the embedding box
Shipping Conditions4℃ or room temperature4℃ or room temperatureDry ice shipping

Sample Requirements

Sample amounts are listed for reference only. Download the Sample Submission Guidelines to learn more. For detailed information, please contact us with your customized requests.


*FFPE glass slides must be positive charged glass slides.

ServiceSample Input Type
FFPE BlocksFFPE SlidesFF OCT Blocks
10x VIsium HD 3’❌❌✅
10x VIsium HD✅✅✅
Stereo-Seq OMNI FFPE✅✅❌
Sample Requirement1 block, placed in a plastic dehydration box• RNA QC: 5-10 FFPE sections (10μm thickness), placed in a tube;
• Library construction: 2-4 FFPE tissue sections (5μm thickness), placed on slides and stored in slide mailing boxes
Tissue thickness >1mm, area <6.5×6.5mm
Storage Conditions4℃ storage after embedding, protected from lightDry and sealed, 4℃ storage for no more than 30 days-80℃ storage, mark the cutting surface on the embedding box
Shipping Conditions4℃ or room temperature4℃ or room temperatureDry ice shipping

Sample Requirements

Sample amounts are listed for reference only. Download the Sample Submission Guidelines to learn more. For detailed information, please contact us with your customized requests.


*FFPE glass slides must be positive charged glass slides.

ServiceSample Input Type
FFPE BlocksFFPE SlidesFF OCT Blocks
10x VIsium HD 3’❌❌✅
10x VIsium HD✅✅✅
Stereo-Seq OMNI FFPE✅✅❌
Sample Requirement1 block, placed in a plastic dehydration box• RNA QC: 5-10 FFPE sections (10μm thickness), placed in a tube;
• Library construction: 2-4 FFPE tissue sections (5μm thickness), placed on slides and stored in slide mailing boxes
Tissue thickness >1mm, area <6.5×6.5mm
Storage Conditions4℃ storage after embedding, protected from lightDry and sealed, 4℃ storage for no more than 30 days-80℃ storage, mark the cutting surface on the embedding box
Shipping Conditions4℃ or room temperature4℃ or room temperatureDry ice shipping

Sample Requirements

Sample amounts are listed for reference only. Download the Sample Submission Guidelines to learn more. For detailed information, please contact us with your customized requests.


*FFPE glass slides must be positive charged glass slides.

ServiceSample Input Type
FFPE BlocksFFPE SlidesFF OCT Blocks
10x VIsium HD 3’❌❌✅
10x VIsium HD✅✅✅
Stereo-Seq OMNI FFPE✅✅❌
Sample Requirement1 block, placed in a plastic dehydration box• RNA QC: 5-10 FFPE sections (10μm thickness), placed in a tube;
• Library construction: 2-4 FFPE tissue sections (5μm thickness), placed on slides and stored in slide mailing boxes
Tissue thickness >1mm, area <6.5×6.5mm
Storage Conditions4℃ storage after embedding, protected from lightDry and sealed, 4℃ storage for no more than 30 days-80℃ storage, mark the cutting surface on the embedding box
Shipping Conditions4℃ or room temperature4℃ or room temperatureDry ice shipping

Sequencing and Analysis

Recommended data outputs and analysis contents displayed are for reference only. For detailed information, please contact us with your customized requests.

10x Visium HD10x Visium HD 3’Stereo-Seq OMNI FFPE
SpeciesHuman & MouseBroad Eukaryotes*
Resolution2um0.5-0.6um
Sequencing PlatformIllumina NovaSeq XPlusDNB-Seq
Read LengthPE150PE75
Recommended Data Amount300M Read Pairs ~ 100Gb/sample210Gb/sample2.5B Reads/sample
Bioinformatics Analysis• Data QC
• Data mapping and gene expression quantification
• Space Ranger/SAW analysis
• Principal component analysis (PCA)
• Clustering and dimensionality reduction analysis
• Cluster marker gene detection
• Spatial distribution of cluster marker genes
• Functional enrichment analysis (GO/KEGG/Reactome pathway enrichment)

Sequencing and Analysis

Recommended data outputs and analysis contents displayed are for reference only. For detailed information, please contact us with your customized requests.

10x Visium HD10x Visium HD 3’Stereo-Seq OMNI FFPE
SpeciesHuman & MouseBroad Eukaryotes*
Resolution2um0.5-0.6um
Sequencing PlatformIllumina NovaSeq XPlusDNB-Seq
Read LengthPE150PE75
Recommended Data Amount300M Read Pairs ~ 100Gb/sample210Gb/sample2.5B Reads/sample
Bioinformatics Analysis• Data QC
• Data mapping and gene expression quantification
• Space Ranger/SAW analysis
• Principal component analysis (PCA)
• Clustering and dimensionality reduction analysis
• Cluster marker gene detection
• Spatial distribution of cluster marker genes
• Functional enrichment analysis (GO/KEGG/Reactome pathway enrichment)

Sequencing and Analysis

Recommended data outputs and analysis contents displayed are for reference only. For detailed information, please contact us with your customized requests.

10x Visium HD10x Visium HD 3’Stereo-Seq OMNI FFPE
SpeciesHuman & MouseBroad Eukaryotes*
Resolution2um0.5-0.6um
Sequencing PlatformIllumina NovaSeq XPlusDNB-Seq
Read LengthPE150PE75
Recommended Data Amount300M Read Pairs ~ 100Gb/sample210Gb/sample2.5B Reads/sample
Bioinformatics Analysis• Data QC
• Data mapping and gene expression quantification
• Space Ranger/SAW analysis
• Principal component analysis (PCA)
• Clustering and dimensionality reduction analysis
• Cluster marker gene detection
• Spatial distribution of cluster marker genes
• Functional enrichment analysis (GO/KEGG/Reactome pathway enrichment)

Sequencing and Analysis

Recommended data outputs and analysis contents displayed are for reference only. For detailed information, please contact us with your customized requests.

10x Visium HD10x Visium HD 3’Stereo-Seq OMNI FFPE
SpeciesHuman & MouseBroad Eukaryotes*
Resolution2um0.5-0.6um
Sequencing PlatformIllumina NovaSeq XPlusDNB-Seq
Read LengthPE150PE75
Recommended Data Amount300M Read Pairs ~ 100Gb/sample210Gb/sample2.5B Reads/sample
Bioinformatics Analysis• Data QC
• Data mapping and gene expression quantification
• Space Ranger/SAW analysis
• Principal component analysis (PCA)
• Clustering and dimensionality reduction analysis
• Cluster marker gene detection
• Spatial distribution of cluster marker genes
• Functional enrichment analysis (GO/KEGG/Reactome pathway enrichment)

Project Workflow

Project Workflow

Project Workflow

Project Workflow

Project Workflow

Project Workflow

Project Workflow

Project Workflow

Specifications

Sample Requirements

Sample amounts are listed for reference only. Download the Sample Submission Guidelines to learn more. For detailed information, please contact us with your customized requests.


*FFPE glass slides must be positive charged glass slides.

ServiceSample Input Type
FFPE BlocksFFPE SlidesFF OCT Blocks
10x VIsium HD 3’❌❌✅
10x VIsium HD✅✅✅
Stereo-Seq OMNI FFPE✅✅❌
Sample Requirement1 block, placed in a plastic dehydration box• RNA QC: 5-10 FFPE sections (10μm thickness), placed in a tube;
• Library construction: 2-4 FFPE tissue sections (5μm thickness), placed on slides and stored in slide mailing boxes
Tissue thickness >1mm, area <6.5×6.5mm
Storage Conditions4℃ storage after embedding, protected from lightDry and sealed, 4℃ storage for no more than 30 days-80℃ storage, mark the cutting surface on the embedding box
Shipping Conditions4℃ or room temperature4℃ or room temperatureDry ice shipping

Sample Requirements

Sample amounts are listed for reference only. Download the Sample Submission Guidelines to learn more. For detailed information, please contact us with your customized requests.


*FFPE glass slides must be positive charged glass slides.

ServiceSample Input Type
FFPE BlocksFFPE SlidesFF OCT Blocks
10x VIsium HD 3’❌❌✅
10x VIsium HD✅✅✅
Stereo-Seq OMNI FFPE✅✅❌
Sample Requirement1 block, placed in a plastic dehydration box• RNA QC: 5-10 FFPE sections (10μm thickness), placed in a tube;
• Library construction: 2-4 FFPE tissue sections (5μm thickness), placed on slides and stored in slide mailing boxes
Tissue thickness >1mm, area <6.5×6.5mm
Storage Conditions4℃ storage after embedding, protected from lightDry and sealed, 4℃ storage for no more than 30 days-80℃ storage, mark the cutting surface on the embedding box
Shipping Conditions4℃ or room temperature4℃ or room temperatureDry ice shipping

Sample Requirements

Sample amounts are listed for reference only. Download the Sample Submission Guidelines to learn more. For detailed information, please contact us with your customized requests.


*FFPE glass slides must be positive charged glass slides.

ServiceSample Input Type
FFPE BlocksFFPE SlidesFF OCT Blocks
10x VIsium HD 3’❌❌✅
10x VIsium HD✅✅✅
Stereo-Seq OMNI FFPE✅✅❌
Sample Requirement1 block, placed in a plastic dehydration box• RNA QC: 5-10 FFPE sections (10μm thickness), placed in a tube;
• Library construction: 2-4 FFPE tissue sections (5μm thickness), placed on slides and stored in slide mailing boxes
Tissue thickness >1mm, area <6.5×6.5mm
Storage Conditions4℃ storage after embedding, protected from lightDry and sealed, 4℃ storage for no more than 30 days-80℃ storage, mark the cutting surface on the embedding box
Shipping Conditions4℃ or room temperature4℃ or room temperatureDry ice shipping

Sample Requirements

Sample amounts are listed for reference only. Download the Sample Submission Guidelines to learn more. For detailed information, please contact us with your customized requests.


*FFPE glass slides must be positive charged glass slides.

ServiceSample Input Type
FFPE BlocksFFPE SlidesFF OCT Blocks
10x VIsium HD 3’❌❌✅
10x VIsium HD✅✅✅
Stereo-Seq OMNI FFPE✅✅❌
Sample Requirement1 block, placed in a plastic dehydration box• RNA QC: 5-10 FFPE sections (10μm thickness), placed in a tube;
• Library construction: 2-4 FFPE tissue sections (5μm thickness), placed on slides and stored in slide mailing boxes
Tissue thickness >1mm, area <6.5×6.5mm
Storage Conditions4℃ storage after embedding, protected from lightDry and sealed, 4℃ storage for no more than 30 days-80℃ storage, mark the cutting surface on the embedding box
Shipping Conditions4℃ or room temperature4℃ or room temperatureDry ice shipping

Sequencing and Analysis

Recommended data outputs and analysis contents displayed are for reference only. For detailed information, please contact us with your customized requests.

10x Visium HD10x Visium HD 3’Stereo-Seq OMNI FFPE
SpeciesHuman & MouseBroad Eukaryotes*
Resolution2um0.5-0.6um
Sequencing PlatformIllumina NovaSeq XPlusDNB-Seq
Read LengthPE150PE75
Recommended Data Amount300M Read Pairs ~ 100Gb/sample210Gb/sample2.5B Reads/sample
Bioinformatics Analysis• Data QC
• Data mapping and gene expression quantification
• Space Ranger/SAW analysis
• Principal component analysis (PCA)
• Clustering and dimensionality reduction analysis
• Cluster marker gene detection
• Spatial distribution of cluster marker genes
• Functional enrichment analysis (GO/KEGG/Reactome pathway enrichment)

Sequencing and Analysis

Recommended data outputs and analysis contents displayed are for reference only. For detailed information, please contact us with your customized requests.

10x Visium HD10x Visium HD 3’Stereo-Seq OMNI FFPE
SpeciesHuman & MouseBroad Eukaryotes*
Resolution2um0.5-0.6um
Sequencing PlatformIllumina NovaSeq XPlusDNB-Seq
Read LengthPE150PE75
Recommended Data Amount300M Read Pairs ~ 100Gb/sample210Gb/sample2.5B Reads/sample
Bioinformatics Analysis• Data QC
• Data mapping and gene expression quantification
• Space Ranger/SAW analysis
• Principal component analysis (PCA)
• Clustering and dimensionality reduction analysis
• Cluster marker gene detection
• Spatial distribution of cluster marker genes
• Functional enrichment analysis (GO/KEGG/Reactome pathway enrichment)

Sequencing and Analysis

Recommended data outputs and analysis contents displayed are for reference only. For detailed information, please contact us with your customized requests.

10x Visium HD10x Visium HD 3’Stereo-Seq OMNI FFPE
SpeciesHuman & MouseBroad Eukaryotes*
Resolution2um0.5-0.6um
Sequencing PlatformIllumina NovaSeq XPlusDNB-Seq
Read LengthPE150PE75
Recommended Data Amount300M Read Pairs ~ 100Gb/sample210Gb/sample2.5B Reads/sample
Bioinformatics Analysis• Data QC
• Data mapping and gene expression quantification
• Space Ranger/SAW analysis
• Principal component analysis (PCA)
• Clustering and dimensionality reduction analysis
• Cluster marker gene detection
• Spatial distribution of cluster marker genes
• Functional enrichment analysis (GO/KEGG/Reactome pathway enrichment)

Sequencing and Analysis

Recommended data outputs and analysis contents displayed are for reference only. For detailed information, please contact us with your customized requests.

10x Visium HD10x Visium HD 3’Stereo-Seq OMNI FFPE
SpeciesHuman & MouseBroad Eukaryotes*
Resolution2um0.5-0.6um
Sequencing PlatformIllumina NovaSeq XPlusDNB-Seq
Read LengthPE150PE75
Recommended Data Amount300M Read Pairs ~ 100Gb/sample210Gb/sample2.5B Reads/sample
Bioinformatics Analysis• Data QC
• Data mapping and gene expression quantification
• Space Ranger/SAW analysis
• Principal component analysis (PCA)
• Clustering and dimensionality reduction analysis
• Cluster marker gene detection
• Spatial distribution of cluster marker genes
• Functional enrichment analysis (GO/KEGG/Reactome pathway enrichment)

Project Workflow

Project Workflow

Project Workflow

Project Workflow

Project Workflow

Project Workflow

Project Workflow

Project Workflow

Resources

Demo Results

Image
Image
1/1
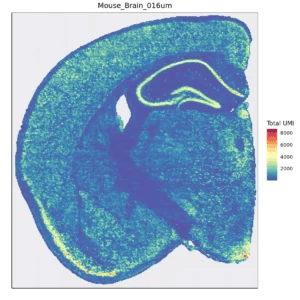
Spatial quantification of gene expression in bins

Space Ranger is used to count the UMI for each gene on every bin, obtaining a bin-gene expression matrix for the sample. After performing data QC, the figure below shows the distribution of UMI per gene across the spatial regions of the tissue.

Image
Image
1/1
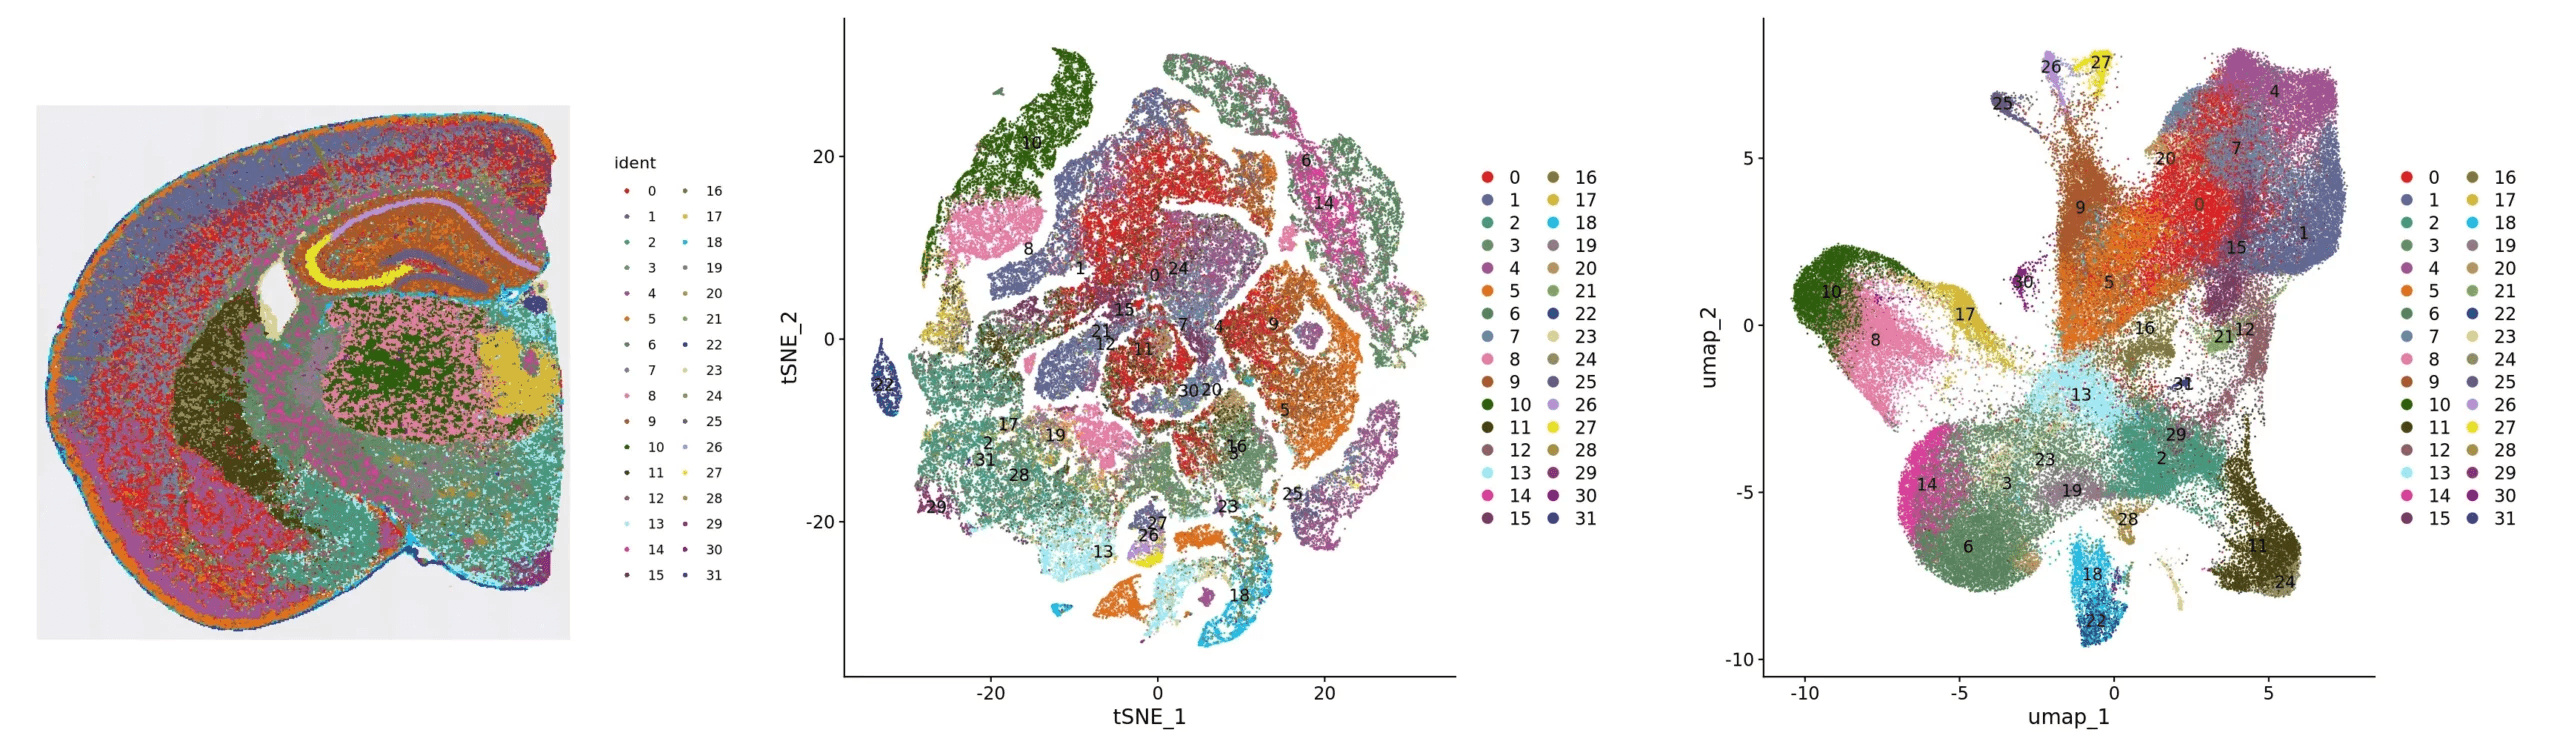
Clustering analysis presentation: spatial distribution, tSNE and UMAP

Cluster_Spatial: spatial distribution map of clusters; Cluster_tSNE: tSNE two-dimensional spatial representation map of clusters; Cluster_UMAP: UMAP two-dimensional spatial representation map of clusters

Image
Image
1/1
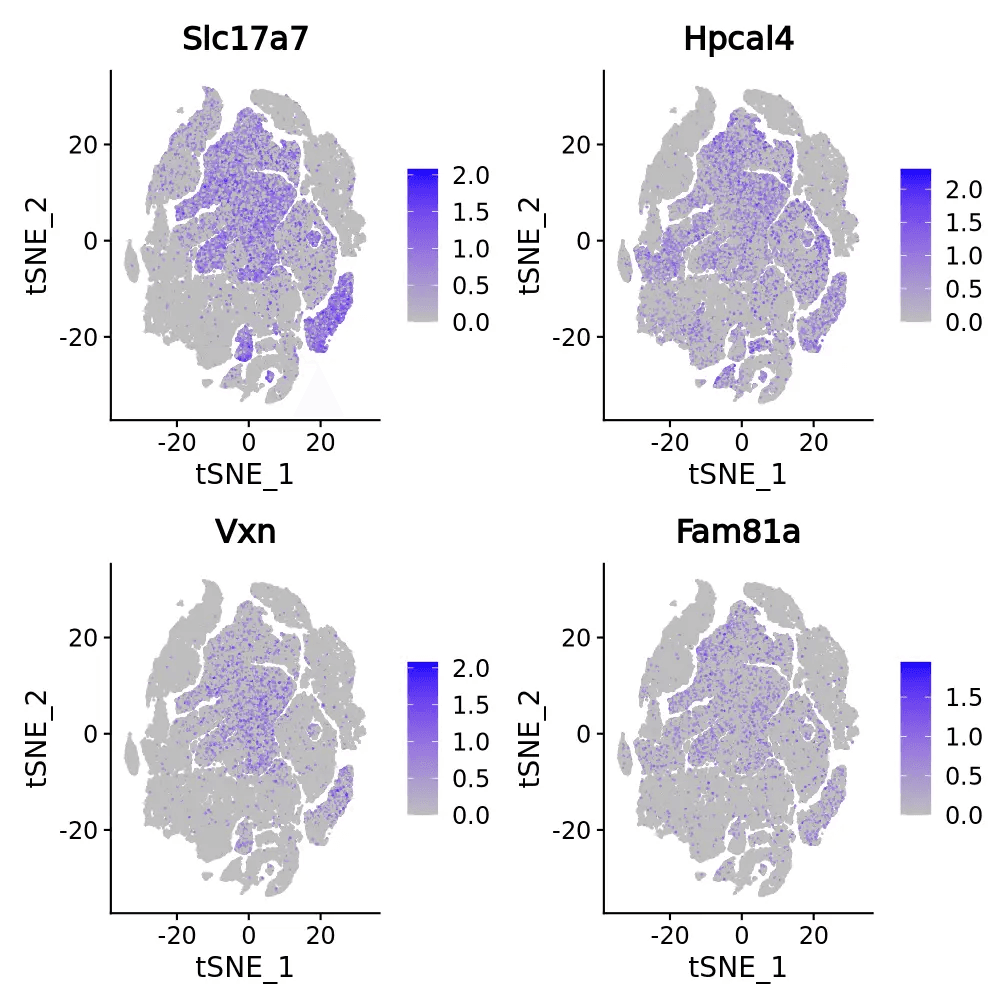
t-SNE and UMAP dimensionality reduction of differentially expressed genes

The top 4 differentially expressed genes of each cluster are displayed in several ways. The figure presents the t-SNE and UMAP dimensional reduction visualization of differentially expressed genes.

Image
Image
1/1
Spatial quantification of gene expression in bins

Space Ranger is used to count the UMI for each gene on every bin, obtaining a bin-gene expression matrix for the sample. After performing data QC, the figure below shows the distribution of UMI per gene across the spatial regions of the tissue.

Image
Image
1/1
Clustering analysis presentation: spatial distribution, tSNE and UMAP

Cluster_Spatial: spatial distribution map of clusters; Cluster_tSNE: tSNE two-dimensional spatial representation map of clusters; Cluster_UMAP: UMAP two-dimensional spatial representation map of clusters

Image
Image
1/1
t-SNE and UMAP dimensionality reduction of differentially expressed genes

The top 4 differentially expressed genes of each cluster are displayed in several ways. The figure presents the t-SNE and UMAP dimensional reduction visualization of differentially expressed genes.

Image
Image
1/1
Spatial quantification of gene expression in bins

Space Ranger is used to count the UMI for each gene on every bin, obtaining a bin-gene expression matrix for the sample. After performing data QC, the figure below shows the distribution of UMI per gene across the spatial regions of the tissue.

Image
Image
1/1
Clustering analysis presentation: spatial distribution, tSNE and UMAP

Cluster_Spatial: spatial distribution map of clusters; Cluster_tSNE: tSNE two-dimensional spatial representation map of clusters; Cluster_UMAP: UMAP two-dimensional spatial representation map of clusters

Image
Image
1/1
t-SNE and UMAP dimensionality reduction of differentially expressed genes

The top 4 differentially expressed genes of each cluster are displayed in several ways. The figure presents the t-SNE and UMAP dimensional reduction visualization of differentially expressed genes.

Service flyers

Icon
Novogene 10x Visium HD & Visium HD (3‘) Spatial Transcriptome Sequencing

Spatial transcriptomics is a revolutionary technology that can profile gene expression within tissue samples while preserving their natural spatial context. Unlike traditional transcriptomics, which analyzes gene expression in bulk, spatial transcriptomics enables detailed visualization of how genes are expressed across different regions and cells of a tissue or organ. This powerful tool has been widely applied in research across oncology, neuroscience, immunology, developmental biology, drug discovery,and more.

Icon
Novogene 10x Visium HD & Visium HD (3‘) Spatial Transcriptome Sequencing

Spatial transcriptomics is a revolutionary technology that can profile gene expression within tissue samples while preserving their natural spatial context. Unlike traditional transcriptomics, which analyzes gene expression in bulk, spatial transcriptomics enables detailed visualization of how genes are expressed across different regions and cells of a tissue or organ. This powerful tool has been widely applied in research across oncology, neuroscience, immunology, developmental biology, drug discovery,and more.

Icon
Novogene 10x Visium HD & Visium HD (3‘) Spatial Transcriptome Sequencing

Spatial transcriptomics is a revolutionary technology that can profile gene expression within tissue samples while preserving their natural spatial context. Unlike traditional transcriptomics, which analyzes gene expression in bulk, spatial transcriptomics enables detailed visualization of how genes are expressed across different regions and cells of a tissue or organ. This powerful tool has been widely applied in research across oncology, neuroscience, immunology, developmental biology, drug discovery,and more.

Icon
Novogene 10x Visium HD & Visium HD (3‘) Spatial Transcriptome Sequencing

Spatial transcriptomics is a revolutionary technology that can profile gene expression within tissue samples while preserving their natural spatial context. Unlike traditional transcriptomics, which analyzes gene expression in bulk, spatial transcriptomics enables detailed visualization of how genes are expressed across different regions and cells of a tissue or organ. This powerful tool has been widely applied in research across oncology, neuroscience, immunology, developmental biology, drug discovery,and more.

Webinars

Seeing is Believing: A Beginner’s Guide to Spatial Transcriptomics

This webinar will present the spatial transcriptomics service from the technology to application, from sample preparation to data analysis, helping you to understand how this powerful tool is applied to unlock the complex biological processes.

(Seeing is Believing: A Beginner’s Guide to Spatial Transcriptomics)
Seeing is Believing: A Beginner’s Guide to Spatial Transcriptomics

This webinar will present the spatial transcriptomics service from the technology to application, from sample preparation to data analysis, helping you to understand how this powerful tool is applied to unlock the complex biological processes.

(Seeing is Believing: A Beginner’s Guide to Spatial Transcriptomics)
Seeing is Believing: A Beginner’s Guide to Spatial Transcriptomics

This webinar will present the spatial transcriptomics service from the technology to application, from sample preparation to data analysis, helping you to understand how this powerful tool is applied to unlock the complex biological processes.

(Seeing is Believing: A Beginner’s Guide to Spatial Transcriptomics)
Seeing is Believing: A Beginner’s Guide to Spatial Transcriptomics

This webinar will present the spatial transcriptomics service from the technology to application, from sample preparation to data analysis, helping you to understand how this powerful tool is applied to unlock the complex biological processes.

(Seeing is Believing: A Beginner’s Guide to Spatial Transcriptomics)

More Services

10x Single Cell RNA Sequencing
(10x Single Cell RNA Sequencing)
10x Single Cell RNA Sequencing
(10x Single Cell RNA Sequencing)
Illumina PIP-seq Single Cell 3’ RNA Sequencing
(Illumina PIP-seq Single Cell 3’ RNA Sequencing)
Illumina PIP-seq Single Cell 3’ RNA Sequencing
(Illumina PIP-seq Single Cell 3’ RNA Sequencing)
Whole transcriptome sequencing
(Whole transcriptome sequencing)
Whole transcriptome sequencing
(Whole transcriptome sequencing)
mRNA Sequencing
(mRNA Sequencing)
mRNA Sequencing
(mRNA Sequencing)
Total RNA Sequencing
(Total RNA Sequencing)
Total RNA Sequencing
(Total RNA Sequencing)
Metatranscriptome Sequencing
(Metatranscriptome Sequencing)
Metatranscriptome Sequencing
(Metatranscriptome Sequencing)
Isoform Sequencing (Full-length Transcrip Sequencing)
(Isoform Sequencing (Full-length Transcrip Sequencing))
Isoform Sequencing (Full-length Transcrip Sequencing)
(Isoform Sequencing (Full-length Transcrip Sequencing))

More Services

10x Single Cell RNA Sequencing
(10x Single Cell RNA Sequencing)
10x Single Cell RNA Sequencing
(10x Single Cell RNA Sequencing)
Illumina PIP-seq Single Cell 3’ RNA Sequencing
(Illumina PIP-seq Single Cell 3’ RNA Sequencing)
Illumina PIP-seq Single Cell 3’ RNA Sequencing
(Illumina PIP-seq Single Cell 3’ RNA Sequencing)
Whole transcriptome sequencing
(Whole transcriptome sequencing)
Whole transcriptome sequencing
(Whole transcriptome sequencing)
mRNA Sequencing
(mRNA Sequencing)
mRNA Sequencing
(mRNA Sequencing)
Total RNA Sequencing
(Total RNA Sequencing)
Total RNA Sequencing
(Total RNA Sequencing)
Metatranscriptome Sequencing
(Metatranscriptome Sequencing)
Metatranscriptome Sequencing
(Metatranscriptome Sequencing)
Isoform Sequencing (Full-length Transcrip Sequencing)
(Isoform Sequencing (Full-length Transcrip Sequencing))
Isoform Sequencing (Full-length Transcrip Sequencing)
(Isoform Sequencing (Full-length Transcrip Sequencing))
Background
Background

Ready to Start Your Project?

Our platform offers tailored solutions for

your unique experimental needs, ensuring a seamless experience from project design to data delivery.


Your Privacy ChoicesPrivacy PolicyCookie PolicyCareers
banner laptop bg
banner mobile bg

Spatial Transcriptomics Sequencing

Combines next-generation sequencing with spatial information to uncover cellular heterogeneity and tissue architecture
OverviewOverview
BenefitsBenefits
ApplicationsApplications
SpecificationsSpecifications
ResourcesResources

Spatial transcriptomics enables the comprehensive characterization of gene expression within its native tissue context, providing unprecedented insights into cellular organization, tissue architecture, and cell–cell interactions.


Novogene offers end-to-end spatial transcriptomics solutions, from experimental design and sample processing to sequencing and advanced bioinformatics analysis. Powered by leading platforms including 10x Genomics Visium and STOmics Stereo-seq, our services deliver high-resolution spatial profiling to support discoveries in oncology, immunology, neuroscience, developmental biology, and precision medicine. Backed by extensive multi-omics expertise and dedicated scientific support, Novogene helps researchers transform complex spatial data into meaningful biological insights.

Spatial Transcriptomics Platforms at Novogene

10x Genomics Visium HD
High-resolution spatial gene expression profiling
Compatible with FFPE, fresh frozen, and fixed frozen samples
Improved gene detection sensitivity across spatial domains
10x Genomics Visium HD
High-resolution spatial gene expression profiling
Compatible with FFPE, fresh frozen, and fixed frozen samples
Improved gene detection sensitivity across spatial domains
10x Genomics Visium HD 3’
Broad eukaryotic species support
Optimized for poly-A transcript detection
Ideal for scalable spatial transcriptomics across diverse species
10x Genomics Visium HD 3’
Broad eukaryotic species support
Optimized for poly-A transcript detection
Ideal for scalable spatial transcriptomics across diverse species
STOmics Stereo-seq OMNI FFPE
Ultra-high throughput spatial transcriptomics
Suitable for large tissue sections
Massive spatial capture area for whole-tissue profiling
STOmics Stereo-seq OMNI FFPE
Ultra-high throughput spatial transcriptomics
Suitable for large tissue sections
Massive spatial capture area for whole-tissue profiling

Spatial Transcriptomics Platforms at Novogene

10x Genomics Visium HD
High-resolution spatial gene expression profiling
Compatible with FFPE, fresh frozen, and fixed frozen samples
Improved gene detection sensitivity across spatial domains
10x Genomics Visium HD
High-resolution spatial gene expression profiling
Compatible with FFPE, fresh frozen, and fixed frozen samples
Improved gene detection sensitivity across spatial domains
10x Genomics Visium HD 3’
Broad eukaryotic species support
Optimized for poly-A transcript detection
Ideal for scalable spatial transcriptomics across diverse species
10x Genomics Visium HD 3’
Broad eukaryotic species support
Optimized for poly-A transcript detection
Ideal for scalable spatial transcriptomics across diverse species
STOmics Stereo-seq OMNI FFPE
Ultra-high throughput spatial transcriptomics
Suitable for large tissue sections
Massive spatial capture area for whole-tissue profiling
STOmics Stereo-seq OMNI FFPE
Ultra-high throughput spatial transcriptomics
Suitable for large tissue sections
Massive spatial capture area for whole-tissue profiling
bg
bg

Benefits of Novogene’s Spatial Transcriptomics Service

PhD-Level Expert TeamPhD-Level Expert Team
PhD-Level Expert Team

Novogene’s PhD-level scientists provide expertise in experimental design and bioinformatics. With 20+ years of pathology and tissue research experience, our team ensures reliable sample processing and accurate spatial data analysis.

PhD-Level Expert Team

Novogene’s PhD-level scientists provide expertise in experimental design and bioinformatics. With 20+ years of pathology and tissue research experience, our team ensures reliable sample processing and accurate spatial data analysis.

Advanced Technology PlatformsAdvanced Technology Platforms
Advanced Technology Platforms

We offer advanced spatial transcriptomics solutions, including Visium HD, Visium HD 3’, and Stereo-seq. State-of-the-art imaging and tissue-processing systems ensure high-quality spatial profiling and analysis.

Advanced Technology Platforms

We offer advanced spatial transcriptomics solutions, including Visium HD, Visium HD 3’, and Stereo-seq. State-of-the-art imaging and tissue-processing systems ensure high-quality spatial profiling and analysis.

Proven Experience Across Diverse ProjectsProven Experience Across Diverse Projects
Proven Experience Across Diverse Projects

Novogene has completed over 4,000 spatial and transcriptomics projects across 50+ species and 100+ tissue types, supporting diverse research areas with robust workflows and reproducible results.

Proven Experience Across Diverse Projects

Novogene has completed over 4,000 spatial and transcriptomics projects across 50+ species and 100+ tissue types, supporting diverse research areas with robust workflows and reproducible results.

High-Impact Scientific OutcomesHigh-Impact Scientific Outcomes
High-Impact Scientific Outcomes

Novogene has contributed to 350+ publications in leading journals, including Nature and Cell. Our high-quality data and analytical expertise support impactful discoveries and successful publication outcomes.

High-Impact Scientific Outcomes

Novogene has contributed to 350+ publications in leading journals, including Nature and Cell. Our high-quality data and analytical expertise support impactful discoveries and successful publication outcomes.

bg
bg

Benefits of Novogene’s Spatial Transcriptomics Service

PhD-Level Expert TeamPhD-Level Expert Team
PhD-Level Expert Team

Novogene’s PhD-level scientists provide expertise in experimental design and bioinformatics. With 20+ years of pathology and tissue research experience, our team ensures reliable sample processing and accurate spatial data analysis.

PhD-Level Expert Team

Novogene’s PhD-level scientists provide expertise in experimental design and bioinformatics. With 20+ years of pathology and tissue research experience, our team ensures reliable sample processing and accurate spatial data analysis.

Advanced Technology PlatformsAdvanced Technology Platforms
Advanced Technology Platforms

We offer advanced spatial transcriptomics solutions, including Visium HD, Visium HD 3’, and Stereo-seq. State-of-the-art imaging and tissue-processing systems ensure high-quality spatial profiling and analysis.

Advanced Technology Platforms

We offer advanced spatial transcriptomics solutions, including Visium HD, Visium HD 3’, and Stereo-seq. State-of-the-art imaging and tissue-processing systems ensure high-quality spatial profiling and analysis.

Proven Experience Across Diverse ProjectsProven Experience Across Diverse Projects
Proven Experience Across Diverse Projects

Novogene has completed over 4,000 spatial and transcriptomics projects across 50+ species and 100+ tissue types, supporting diverse research areas with robust workflows and reproducible results.

Proven Experience Across Diverse Projects

Novogene has completed over 4,000 spatial and transcriptomics projects across 50+ species and 100+ tissue types, supporting diverse research areas with robust workflows and reproducible results.

High-Impact Scientific OutcomesHigh-Impact Scientific Outcomes
High-Impact Scientific Outcomes

Novogene has contributed to 350+ publications in leading journals, including Nature and Cell. Our high-quality data and analytical expertise support impactful discoveries and successful publication outcomes.

High-Impact Scientific Outcomes

Novogene has contributed to 350+ publications in leading journals, including Nature and Cell. Our high-quality data and analytical expertise support impactful discoveries and successful publication outcomes.

Applications of Spatial Transcriptomics

Spatial transcriptomics has been assisting researchers in the following research areas, including:

Cancer Research

Explore the spatial architecture of tumors by mapping gene expression directly within tissue sections. This approach helps uncover interactions between cancer, immune, and stromal cells that influence disease progression and treatment outcomes.

Cancer Research

Explore the spatial architecture of tumors by mapping gene expression directly within tissue sections. This approach helps uncover interactions between cancer, immune, and stromal cells that influence disease progression and treatment outcomes.

Developmental Biology

Gain insight into how tissues and organs form by linking gene activity to precise anatomical locations. Spatially resolved data provide a powerful framework for studying development, differentiation, and morphogenesis.

Developmental Biology

Gain insight into how tissues and organs form by linking gene activity to precise anatomical locations. Spatially resolved data provide a powerful framework for studying development, differentiation, and morphogenesis.

Neuroscience

Investigate molecular patterns across brain regions and neural circuits while preserving tissue context. Spatial analysis enables a deeper understanding of brain organization, function, and neurological disorders.

Neuroscience

Investigate molecular patterns across brain regions and neural circuits while preserving tissue context. Spatial analysis enables a deeper understanding of brain organization, function, and neurological disorders.

Infectious Disease & Immune Response

Characterize where immune cells reside, interact, and become activated during infection or inflammation. These spatial insights help reveal mechanisms of host defense, tissue immunity, and disease pathogenesis.

Infectious Disease & Immune Response

Characterize where immune cells reside, interact, and become activated during infection or inflammation. These spatial insights help reveal mechanisms of host defense, tissue immunity, and disease pathogenesis.

Applications of Spatial Transcriptomics

Spatial transcriptomics has been assisting researchers in the following research areas, including:

Cancer Research

Explore the spatial architecture of tumors by mapping gene expression directly within tissue sections. This approach helps uncover interactions between cancer, immune, and stromal cells that influence disease progression and treatment outcomes.

Cancer Research

Explore the spatial architecture of tumors by mapping gene expression directly within tissue sections. This approach helps uncover interactions between cancer, immune, and stromal cells that influence disease progression and treatment outcomes.

Developmental Biology

Gain insight into how tissues and organs form by linking gene activity to precise anatomical locations. Spatially resolved data provide a powerful framework for studying development, differentiation, and morphogenesis.

Developmental Biology

Gain insight into how tissues and organs form by linking gene activity to precise anatomical locations. Spatially resolved data provide a powerful framework for studying development, differentiation, and morphogenesis.

Neuroscience

Investigate molecular patterns across brain regions and neural circuits while preserving tissue context. Spatial analysis enables a deeper understanding of brain organization, function, and neurological disorders.

Neuroscience

Investigate molecular patterns across brain regions and neural circuits while preserving tissue context. Spatial analysis enables a deeper understanding of brain organization, function, and neurological disorders.

Infectious Disease & Immune Response

Characterize where immune cells reside, interact, and become activated during infection or inflammation. These spatial insights help reveal mechanisms of host defense, tissue immunity, and disease pathogenesis.

Infectious Disease & Immune Response

Characterize where immune cells reside, interact, and become activated during infection or inflammation. These spatial insights help reveal mechanisms of host defense, tissue immunity, and disease pathogenesis.

Specifications

Sample Requirements

Sample amounts are listed for reference only. Download the Sample Submission Guidelines to learn more. For detailed information, please contact us with your customized requests.


*FFPE glass slides must be positive charged glass slides.

ServiceSample Input Type
FFPE BlocksFFPE SlidesFF OCT Blocks
10x VIsium HD 3’❌❌✅
10x VIsium HD✅✅✅
Stereo-Seq OMNI FFPE✅✅❌
Sample Requirement1 block, placed in a plastic dehydration box• RNA QC: 5-10 FFPE sections (10μm thickness), placed in a tube;
• Library construction: 2-4 FFPE tissue sections (5μm thickness), placed on slides and stored in slide mailing boxes
Tissue thickness >1mm, area <6.5×6.5mm
Storage Conditions4℃ storage after embedding, protected from lightDry and sealed, 4℃ storage for no more than 30 days-80℃ storage, mark the cutting surface on the embedding box
Shipping Conditions4℃ or room temperature4℃ or room temperatureDry ice shipping

Sample Requirements

Sample amounts are listed for reference only. Download the Sample Submission Guidelines to learn more. For detailed information, please contact us with your customized requests.


*FFPE glass slides must be positive charged glass slides.

ServiceSample Input Type
FFPE BlocksFFPE SlidesFF OCT Blocks
10x VIsium HD 3’❌❌✅
10x VIsium HD✅✅✅
Stereo-Seq OMNI FFPE✅✅❌
Sample Requirement1 block, placed in a plastic dehydration box• RNA QC: 5-10 FFPE sections (10μm thickness), placed in a tube;
• Library construction: 2-4 FFPE tissue sections (5μm thickness), placed on slides and stored in slide mailing boxes
Tissue thickness >1mm, area <6.5×6.5mm
Storage Conditions4℃ storage after embedding, protected from lightDry and sealed, 4℃ storage for no more than 30 days-80℃ storage, mark the cutting surface on the embedding box
Shipping Conditions4℃ or room temperature4℃ or room temperatureDry ice shipping

Sample Requirements

Sample amounts are listed for reference only. Download the Sample Submission Guidelines to learn more. For detailed information, please contact us with your customized requests.


*FFPE glass slides must be positive charged glass slides.

ServiceSample Input Type
FFPE BlocksFFPE SlidesFF OCT Blocks
10x VIsium HD 3’❌❌✅
10x VIsium HD✅✅✅
Stereo-Seq OMNI FFPE✅✅❌
Sample Requirement1 block, placed in a plastic dehydration box• RNA QC: 5-10 FFPE sections (10μm thickness), placed in a tube;
• Library construction: 2-4 FFPE tissue sections (5μm thickness), placed on slides and stored in slide mailing boxes
Tissue thickness >1mm, area <6.5×6.5mm
Storage Conditions4℃ storage after embedding, protected from lightDry and sealed, 4℃ storage for no more than 30 days-80℃ storage, mark the cutting surface on the embedding box
Shipping Conditions4℃ or room temperature4℃ or room temperatureDry ice shipping

Sample Requirements

Sample amounts are listed for reference only. Download the Sample Submission Guidelines to learn more. For detailed information, please contact us with your customized requests.


*FFPE glass slides must be positive charged glass slides.

ServiceSample Input Type
FFPE BlocksFFPE SlidesFF OCT Blocks
10x VIsium HD 3’❌❌✅
10x VIsium HD✅✅✅
Stereo-Seq OMNI FFPE✅✅❌
Sample Requirement1 block, placed in a plastic dehydration box• RNA QC: 5-10 FFPE sections (10μm thickness), placed in a tube;
• Library construction: 2-4 FFPE tissue sections (5μm thickness), placed on slides and stored in slide mailing boxes
Tissue thickness >1mm, area <6.5×6.5mm
Storage Conditions4℃ storage after embedding, protected from lightDry and sealed, 4℃ storage for no more than 30 days-80℃ storage, mark the cutting surface on the embedding box
Shipping Conditions4℃ or room temperature4℃ or room temperatureDry ice shipping

Sequencing and Analysis

Recommended data outputs and analysis contents displayed are for reference only. For detailed information, please contact us with your customized requests.

10x Visium HD10x Visium HD 3’Stereo-Seq OMNI FFPE
SpeciesHuman & MouseBroad Eukaryotes*
Resolution2um0.5-0.6um
Sequencing PlatformIllumina NovaSeq XPlusDNB-Seq
Read LengthPE150PE75
Recommended Data Amount300M Read Pairs ~ 100Gb/sample210Gb/sample2.5B Reads/sample
Bioinformatics Analysis• Data QC
• Data mapping and gene expression quantification
• Space Ranger/SAW analysis
• Principal component analysis (PCA)
• Clustering and dimensionality reduction analysis
• Cluster marker gene detection
• Spatial distribution of cluster marker genes
• Functional enrichment analysis (GO/KEGG/Reactome pathway enrichment)

Sequencing and Analysis

Recommended data outputs and analysis contents displayed are for reference only. For detailed information, please contact us with your customized requests.

10x Visium HD10x Visium HD 3’Stereo-Seq OMNI FFPE
SpeciesHuman & MouseBroad Eukaryotes*
Resolution2um0.5-0.6um
Sequencing PlatformIllumina NovaSeq XPlusDNB-Seq
Read LengthPE150PE75
Recommended Data Amount300M Read Pairs ~ 100Gb/sample210Gb/sample2.5B Reads/sample
Bioinformatics Analysis• Data QC
• Data mapping and gene expression quantification
• Space Ranger/SAW analysis
• Principal component analysis (PCA)
• Clustering and dimensionality reduction analysis
• Cluster marker gene detection
• Spatial distribution of cluster marker genes
• Functional enrichment analysis (GO/KEGG/Reactome pathway enrichment)

Sequencing and Analysis

Recommended data outputs and analysis contents displayed are for reference only. For detailed information, please contact us with your customized requests.

10x Visium HD10x Visium HD 3’Stereo-Seq OMNI FFPE
SpeciesHuman & MouseBroad Eukaryotes*
Resolution2um0.5-0.6um
Sequencing PlatformIllumina NovaSeq XPlusDNB-Seq
Read LengthPE150PE75
Recommended Data Amount300M Read Pairs ~ 100Gb/sample210Gb/sample2.5B Reads/sample
Bioinformatics Analysis• Data QC
• Data mapping and gene expression quantification
• Space Ranger/SAW analysis
• Principal component analysis (PCA)
• Clustering and dimensionality reduction analysis
• Cluster marker gene detection
• Spatial distribution of cluster marker genes
• Functional enrichment analysis (GO/KEGG/Reactome pathway enrichment)

Sequencing and Analysis

Recommended data outputs and analysis contents displayed are for reference only. For detailed information, please contact us with your customized requests.

10x Visium HD10x Visium HD 3’Stereo-Seq OMNI FFPE
SpeciesHuman & MouseBroad Eukaryotes*
Resolution2um0.5-0.6um
Sequencing PlatformIllumina NovaSeq XPlusDNB-Seq
Read LengthPE150PE75
Recommended Data Amount300M Read Pairs ~ 100Gb/sample210Gb/sample2.5B Reads/sample
Bioinformatics Analysis• Data QC
• Data mapping and gene expression quantification
• Space Ranger/SAW analysis
• Principal component analysis (PCA)
• Clustering and dimensionality reduction analysis
• Cluster marker gene detection
• Spatial distribution of cluster marker genes
• Functional enrichment analysis (GO/KEGG/Reactome pathway enrichment)

Project Workflow

Project Workflow

Project Workflow

Project Workflow

Project Workflow

Project Workflow

Project Workflow

Project Workflow

Specifications

Sample Requirements

Sample amounts are listed for reference only. Download the Sample Submission Guidelines to learn more. For detailed information, please contact us with your customized requests.


*FFPE glass slides must be positive charged glass slides.

ServiceSample Input Type
FFPE BlocksFFPE SlidesFF OCT Blocks
10x VIsium HD 3’❌❌✅
10x VIsium HD✅✅✅
Stereo-Seq OMNI FFPE✅✅❌
Sample Requirement1 block, placed in a plastic dehydration box• RNA QC: 5-10 FFPE sections (10μm thickness), placed in a tube;
• Library construction: 2-4 FFPE tissue sections (5μm thickness), placed on slides and stored in slide mailing boxes
Tissue thickness >1mm, area <6.5×6.5mm
Storage Conditions4℃ storage after embedding, protected from lightDry and sealed, 4℃ storage for no more than 30 days-80℃ storage, mark the cutting surface on the embedding box
Shipping Conditions4℃ or room temperature4℃ or room temperatureDry ice shipping

Sample Requirements

Sample amounts are listed for reference only. Download the Sample Submission Guidelines to learn more. For detailed information, please contact us with your customized requests.


*FFPE glass slides must be positive charged glass slides.

ServiceSample Input Type
FFPE BlocksFFPE SlidesFF OCT Blocks
10x VIsium HD 3’❌❌✅
10x VIsium HD✅✅✅
Stereo-Seq OMNI FFPE✅✅❌
Sample Requirement1 block, placed in a plastic dehydration box• RNA QC: 5-10 FFPE sections (10μm thickness), placed in a tube;
• Library construction: 2-4 FFPE tissue sections (5μm thickness), placed on slides and stored in slide mailing boxes
Tissue thickness >1mm, area <6.5×6.5mm
Storage Conditions4℃ storage after embedding, protected from lightDry and sealed, 4℃ storage for no more than 30 days-80℃ storage, mark the cutting surface on the embedding box
Shipping Conditions4℃ or room temperature4℃ or room temperatureDry ice shipping

Sample Requirements

Sample amounts are listed for reference only. Download the Sample Submission Guidelines to learn more. For detailed information, please contact us with your customized requests.


*FFPE glass slides must be positive charged glass slides.

ServiceSample Input Type
FFPE BlocksFFPE SlidesFF OCT Blocks
10x VIsium HD 3’❌❌✅
10x VIsium HD✅✅✅
Stereo-Seq OMNI FFPE✅✅❌
Sample Requirement1 block, placed in a plastic dehydration box• RNA QC: 5-10 FFPE sections (10μm thickness), placed in a tube;
• Library construction: 2-4 FFPE tissue sections (5μm thickness), placed on slides and stored in slide mailing boxes
Tissue thickness >1mm, area <6.5×6.5mm
Storage Conditions4℃ storage after embedding, protected from lightDry and sealed, 4℃ storage for no more than 30 days-80℃ storage, mark the cutting surface on the embedding box
Shipping Conditions4℃ or room temperature4℃ or room temperatureDry ice shipping

Sample Requirements

Sample amounts are listed for reference only. Download the Sample Submission Guidelines to learn more. For detailed information, please contact us with your customized requests.


*FFPE glass slides must be positive charged glass slides.

ServiceSample Input Type
FFPE BlocksFFPE SlidesFF OCT Blocks
10x VIsium HD 3’❌❌✅
10x VIsium HD✅✅✅
Stereo-Seq OMNI FFPE✅✅❌
Sample Requirement1 block, placed in a plastic dehydration box• RNA QC: 5-10 FFPE sections (10μm thickness), placed in a tube;
• Library construction: 2-4 FFPE tissue sections (5μm thickness), placed on slides and stored in slide mailing boxes
Tissue thickness >1mm, area <6.5×6.5mm
Storage Conditions4℃ storage after embedding, protected from lightDry and sealed, 4℃ storage for no more than 30 days-80℃ storage, mark the cutting surface on the embedding box
Shipping Conditions4℃ or room temperature4℃ or room temperatureDry ice shipping

Sequencing and Analysis

Recommended data outputs and analysis contents displayed are for reference only. For detailed information, please contact us with your customized requests.

10x Visium HD10x Visium HD 3’Stereo-Seq OMNI FFPE
SpeciesHuman & MouseBroad Eukaryotes*
Resolution2um0.5-0.6um
Sequencing PlatformIllumina NovaSeq XPlusDNB-Seq
Read LengthPE150PE75
Recommended Data Amount300M Read Pairs ~ 100Gb/sample210Gb/sample2.5B Reads/sample
Bioinformatics Analysis• Data QC
• Data mapping and gene expression quantification
• Space Ranger/SAW analysis
• Principal component analysis (PCA)
• Clustering and dimensionality reduction analysis
• Cluster marker gene detection
• Spatial distribution of cluster marker genes
• Functional enrichment analysis (GO/KEGG/Reactome pathway enrichment)

Sequencing and Analysis

Recommended data outputs and analysis contents displayed are for reference only. For detailed information, please contact us with your customized requests.

10x Visium HD10x Visium HD 3’Stereo-Seq OMNI FFPE
SpeciesHuman & MouseBroad Eukaryotes*
Resolution2um0.5-0.6um
Sequencing PlatformIllumina NovaSeq XPlusDNB-Seq
Read LengthPE150PE75
Recommended Data Amount300M Read Pairs ~ 100Gb/sample210Gb/sample2.5B Reads/sample
Bioinformatics Analysis• Data QC
• Data mapping and gene expression quantification
• Space Ranger/SAW analysis
• Principal component analysis (PCA)
• Clustering and dimensionality reduction analysis
• Cluster marker gene detection
• Spatial distribution of cluster marker genes
• Functional enrichment analysis (GO/KEGG/Reactome pathway enrichment)

Sequencing and Analysis

Recommended data outputs and analysis contents displayed are for reference only. For detailed information, please contact us with your customized requests.

10x Visium HD10x Visium HD 3’Stereo-Seq OMNI FFPE
SpeciesHuman & MouseBroad Eukaryotes*
Resolution2um0.5-0.6um
Sequencing PlatformIllumina NovaSeq XPlusDNB-Seq
Read LengthPE150PE75
Recommended Data Amount300M Read Pairs ~ 100Gb/sample210Gb/sample2.5B Reads/sample
Bioinformatics Analysis• Data QC
• Data mapping and gene expression quantification
• Space Ranger/SAW analysis
• Principal component analysis (PCA)
• Clustering and dimensionality reduction analysis
• Cluster marker gene detection
• Spatial distribution of cluster marker genes
• Functional enrichment analysis (GO/KEGG/Reactome pathway enrichment)

Sequencing and Analysis

Recommended data outputs and analysis contents displayed are for reference only. For detailed information, please contact us with your customized requests.

10x Visium HD10x Visium HD 3’Stereo-Seq OMNI FFPE
SpeciesHuman & MouseBroad Eukaryotes*
Resolution2um0.5-0.6um
Sequencing PlatformIllumina NovaSeq XPlusDNB-Seq
Read LengthPE150PE75
Recommended Data Amount300M Read Pairs ~ 100Gb/sample210Gb/sample2.5B Reads/sample
Bioinformatics Analysis• Data QC
• Data mapping and gene expression quantification
• Space Ranger/SAW analysis
• Principal component analysis (PCA)
• Clustering and dimensionality reduction analysis
• Cluster marker gene detection
• Spatial distribution of cluster marker genes
• Functional enrichment analysis (GO/KEGG/Reactome pathway enrichment)

Project Workflow

Project Workflow

Project Workflow

Project Workflow

Project Workflow

Project Workflow

Project Workflow

Project Workflow

Resources

Demo Results

Image
Image
1/1
Spatial quantification of gene expression in bins

Space Ranger is used to count the UMI for each gene on every bin, obtaining a bin-gene expression matrix for the sample. After performing data QC, the figure below shows the distribution of UMI per gene across the spatial regions of the tissue.

Image
Image
1/1
Clustering analysis presentation: spatial distribution, tSNE and UMAP

Cluster_Spatial: spatial distribution map of clusters; Cluster_tSNE: tSNE two-dimensional spatial representation map of clusters; Cluster_UMAP: UMAP two-dimensional spatial representation map of clusters

Image
Image
1/1
t-SNE and UMAP dimensionality reduction of differentially expressed genes

The top 4 differentially expressed genes of each cluster are displayed in several ways. The figure presents the t-SNE and UMAP dimensional reduction visualization of differentially expressed genes.

Image
Image
1/1
Spatial quantification of gene expression in bins

Space Ranger is used to count the UMI for each gene on every bin, obtaining a bin-gene expression matrix for the sample. After performing data QC, the figure below shows the distribution of UMI per gene across the spatial regions of the tissue.

Image
Image
1/1
Clustering analysis presentation: spatial distribution, tSNE and UMAP

Cluster_Spatial: spatial distribution map of clusters; Cluster_tSNE: tSNE two-dimensional spatial representation map of clusters; Cluster_UMAP: UMAP two-dimensional spatial representation map of clusters

Image
Image
1/1
t-SNE and UMAP dimensionality reduction of differentially expressed genes

The top 4 differentially expressed genes of each cluster are displayed in several ways. The figure presents the t-SNE and UMAP dimensional reduction visualization of differentially expressed genes.

Image
Image
1/1
Spatial quantification of gene expression in bins

Space Ranger is used to count the UMI for each gene on every bin, obtaining a bin-gene expression matrix for the sample. After performing data QC, the figure below shows the distribution of UMI per gene across the spatial regions of the tissue.

Image
Image
1/1
Clustering analysis presentation: spatial distribution, tSNE and UMAP

Cluster_Spatial: spatial distribution map of clusters; Cluster_tSNE: tSNE two-dimensional spatial representation map of clusters; Cluster_UMAP: UMAP two-dimensional spatial representation map of clusters

Image
Image
1/1
t-SNE and UMAP dimensionality reduction of differentially expressed genes

The top 4 differentially expressed genes of each cluster are displayed in several ways. The figure presents the t-SNE and UMAP dimensional reduction visualization of differentially expressed genes.

Service flyers

Icon
Novogene 10x Visium HD & Visium HD (3‘) Spatial Transcriptome Sequencing

Spatial transcriptomics is a revolutionary technology that can profile gene expression within tissue samples while preserving their natural spatial context. Unlike traditional transcriptomics, which analyzes gene expression in bulk, spatial transcriptomics enables detailed visualization of how genes are expressed across different regions and cells of a tissue or organ. This powerful tool has been widely applied in research across oncology, neuroscience, immunology, developmental biology, drug discovery,and more.

Icon
Novogene 10x Visium HD & Visium HD (3‘) Spatial Transcriptome Sequencing

Spatial transcriptomics is a revolutionary technology that can profile gene expression within tissue samples while preserving their natural spatial context. Unlike traditional transcriptomics, which analyzes gene expression in bulk, spatial transcriptomics enables detailed visualization of how genes are expressed across different regions and cells of a tissue or organ. This powerful tool has been widely applied in research across oncology, neuroscience, immunology, developmental biology, drug discovery,and more.

Icon
Novogene 10x Visium HD & Visium HD (3‘) Spatial Transcriptome Sequencing

Spatial transcriptomics is a revolutionary technology that can profile gene expression within tissue samples while preserving their natural spatial context. Unlike traditional transcriptomics, which analyzes gene expression in bulk, spatial transcriptomics enables detailed visualization of how genes are expressed across different regions and cells of a tissue or organ. This powerful tool has been widely applied in research across oncology, neuroscience, immunology, developmental biology, drug discovery,and more.

Icon
Novogene 10x Visium HD & Visium HD (3‘) Spatial Transcriptome Sequencing

Spatial transcriptomics is a revolutionary technology that can profile gene expression within tissue samples while preserving their natural spatial context. Unlike traditional transcriptomics, which analyzes gene expression in bulk, spatial transcriptomics enables detailed visualization of how genes are expressed across different regions and cells of a tissue or organ. This powerful tool has been widely applied in research across oncology, neuroscience, immunology, developmental biology, drug discovery,and more.

Webinars

Seeing is Believing: A Beginner’s Guide to Spatial Transcriptomics

This webinar will present the spatial transcriptomics service from the technology to application, from sample preparation to data analysis, helping you to understand how this powerful tool is applied to unlock the complex biological processes.

(Seeing is Believing: A Beginner’s Guide to Spatial Transcriptomics)
Seeing is Believing: A Beginner’s Guide to Spatial Transcriptomics

This webinar will present the spatial transcriptomics service from the technology to application, from sample preparation to data analysis, helping you to understand how this powerful tool is applied to unlock the complex biological processes.

(Seeing is Believing: A Beginner’s Guide to Spatial Transcriptomics)
Seeing is Believing: A Beginner’s Guide to Spatial Transcriptomics

This webinar will present the spatial transcriptomics service from the technology to application, from sample preparation to data analysis, helping you to understand how this powerful tool is applied to unlock the complex biological processes.

(Seeing is Believing: A Beginner’s Guide to Spatial Transcriptomics)
Seeing is Believing: A Beginner’s Guide to Spatial Transcriptomics

This webinar will present the spatial transcriptomics service from the technology to application, from sample preparation to data analysis, helping you to understand how this powerful tool is applied to unlock the complex biological processes.

(Seeing is Believing: A Beginner’s Guide to Spatial Transcriptomics)

More Services

10x Single Cell RNA Sequencing
(10x Single Cell RNA Sequencing)
10x Single Cell RNA Sequencing
(10x Single Cell RNA Sequencing)
Illumina PIP-seq Single Cell 3’ RNA Sequencing
(Illumina PIP-seq Single Cell 3’ RNA Sequencing)
Illumina PIP-seq Single Cell 3’ RNA Sequencing
(Illumina PIP-seq Single Cell 3’ RNA Sequencing)
Whole transcriptome sequencing
(Whole transcriptome sequencing)
Whole transcriptome sequencing
(Whole transcriptome sequencing)
mRNA Sequencing
(mRNA Sequencing)
mRNA Sequencing
(mRNA Sequencing)
Total RNA Sequencing
(Total RNA Sequencing)
Total RNA Sequencing
(Total RNA Sequencing)
Metatranscriptome Sequencing
(Metatranscriptome Sequencing)
Metatranscriptome Sequencing
(Metatranscriptome Sequencing)
Isoform Sequencing (Full-length Transcrip Sequencing)
(Isoform Sequencing (Full-length Transcrip Sequencing))
Isoform Sequencing (Full-length Transcrip Sequencing)
(Isoform Sequencing (Full-length Transcrip Sequencing))

More Services

10x Single Cell RNA Sequencing
(10x Single Cell RNA Sequencing)
10x Single Cell RNA Sequencing
(10x Single Cell RNA Sequencing)
Illumina PIP-seq Single Cell 3’ RNA Sequencing
(Illumina PIP-seq Single Cell 3’ RNA Sequencing)
Illumina PIP-seq Single Cell 3’ RNA Sequencing
(Illumina PIP-seq Single Cell 3’ RNA Sequencing)
Whole transcriptome sequencing
(Whole transcriptome sequencing)
Whole transcriptome sequencing
(Whole transcriptome sequencing)
mRNA Sequencing
(mRNA Sequencing)
mRNA Sequencing
(mRNA Sequencing)
Total RNA Sequencing
(Total RNA Sequencing)
Total RNA Sequencing
(Total RNA Sequencing)
Metatranscriptome Sequencing
(Metatranscriptome Sequencing)
Metatranscriptome Sequencing
(Metatranscriptome Sequencing)
Isoform Sequencing (Full-length Transcrip Sequencing)
(Isoform Sequencing (Full-length Transcrip Sequencing))
Isoform Sequencing (Full-length Transcrip Sequencing)
(Isoform Sequencing (Full-length Transcrip Sequencing))
Background
Background

Ready to Start Your Project?

Our platform offers tailored solutions for

your unique experimental needs, ensuring a seamless experience from project design to data delivery.


Your Privacy ChoicesPrivacy PolicyCookie PolicyCareers