
• Cart
    • Quote
    • Inquiry
    • Cart
    • Quote
    • Inquiry
Novogene
  • Novogene
  • Genomics
    • Human Whole Genome Sequencing
    • Whole Exome Sequencing
    • Plant and Animal Whole Genome Sequencing
    • Plant and Animal De Novo Sequencing
    • Microbial Whole Genome Sequencing
    • Microbial De Novo Sequencing

    Metagenomics

    • Shotgun Metagenomics Sequencing
    • Amplicon Sequencing

    Transcriptomics

    • mRNA Sequencing
    • Swift & Express mRNA Sequencing New!
    • Full-Length Transcriptome Sequencing
    • Prokaryotic RNA Sequencing
    • Metatranscriptome Sequencing
    • Total RNA Sequencing
    • Small RNA Sequencing (sRNA‑seq)
    • Whole Transcriptome Sequencing

    Single Cell & Spatial Omics

    • 10x Single Cell Gene Expression
    • Illumina PIP-seq Single Cell 3’ RNA Sequencing New!
    • Spatial Transcriptomics Sequencing New!

    Epigenomics

    • Whole Genome Bisulfite Sequencing (WGBS)
    • Enzymatic Methylation Sequencing
    • Directed Methylation Sequencing (DM-Seq) New!
    • RNA Immunoprecipitation Sequencing (RIP-seq)
    • Chromatin Immunoprecipitation Sequencing (ChIP-seq)
    • Cleavage Under Targets & Tagmentation (CUT&Tag) New!
    • Assay for Transposase-Accessible Chromatin with Sequencing (ATAC-seq)
    • Reduced Representation Bisulfite Sequencing (RRBS)

    Proteomics

    • Quantitative Proteomics New!
    • PTM Proteomics New!
    • Olink Proteomics New!

    Metabolomics

    • Untargeted Metabolomics

    Premade Library

    • Sequencing Only on Illumina Sequencer
    • Sequencing Only on Ultima Sequencer
  • PromotionsPromotions
    • Platforms
    • Service & Support
    • Automated Delivery Platform (Falcon)
    • Bioinformatics Analysis Tool (NovoMagic)
    • Customer Service System (CSS)
    • Case Study
    • Blog
    • Webinar
    • Brochure
    • Cancer Research
    • Immuno-oncology
    • Agrigenomics
    • Environment
    • Food Science
    • Human Microbiome
    • Plant and Animal Microbiome
    • Drug Discovery and Development
    • Rare and Complex Diseases
    • About Us
    • Our Locations
    • News & Events
    • Careers
  • Contact UsContact Us
    • mRNA Sequencing
    • Illumina Lane Sequencing

ServicesServices menu

CompanyCompany menu

Contact UsContact Us menu

Service SupportService Support menu

Services
mRNA SequencingSwift & Express mRNA SequencingTotal RNA SequencingHuman Whole Genome SequencingWhole Exome Sequencing10x Single Cell Gene ExpressionIllumina PIP-seq Single Cell 3’ RNA SequencingSpatial Transcriptomics SequencingWhole Genome Bisulfite Sequencing (WGBS)Quantitative ProteomicsUntargeted MetabolomicsShotgun Metagenomics SequencingMetatranscriptome SequencingSequencing Only on Illumina SequencerSequencing Only on Ultima SequencerFull-Length Transcriptome SequencingChromatin Immunoprecipitation Sequencing (ChIP-seq)
Company
About UsOur LocationsNews & EventsCareers
Contact Us
Contact Us
Service Support
Automated Delivery Platform (Falcon)Bioinformatics Analysis Tool (NovoMagic)Customer Service System (CSS)
LinkedInLinkedIn hoverYouTubeYouTube hoverXX hoverMetaMeta hoverInstagramInstagram hover
Copyright © 2026 Novogene Corporation Inc. All rights reserved. For Research Use Only.
    • Cart
    • Quote
    • Inquiry
    • Cart
    • Quote
    • Inquiry
Novogene
  • Novogene
  • Genomics
    • Human Whole Genome Sequencing
    • Whole Exome Sequencing
    • Plant and Animal Whole Genome Sequencing
    • Plant and Animal De Novo Sequencing
    • Microbial Whole Genome Sequencing
    • Microbial De Novo Sequencing

    Metagenomics

    • Shotgun Metagenomics Sequencing
    • Amplicon Sequencing

    Transcriptomics

    • mRNA Sequencing
    • Swift & Express mRNA Sequencing New!
    • Full-Length Transcriptome Sequencing
    • Prokaryotic RNA Sequencing
    • Metatranscriptome Sequencing
    • Total RNA Sequencing
    • Small RNA Sequencing (sRNA‑seq)
    • Whole Transcriptome Sequencing

    Single Cell & Spatial Omics

    • 10x Single Cell Gene Expression
    • Illumina PIP-seq Single Cell 3’ RNA Sequencing New!
    • Spatial Transcriptomics Sequencing New!

    Epigenomics

    • Whole Genome Bisulfite Sequencing (WGBS)
    • Enzymatic Methylation Sequencing
    • Directed Methylation Sequencing (DM-Seq) New!
    • RNA Immunoprecipitation Sequencing (RIP-seq)
    • Chromatin Immunoprecipitation Sequencing (ChIP-seq)
    • Cleavage Under Targets & Tagmentation (CUT&Tag) New!
    • Assay for Transposase-Accessible Chromatin with Sequencing (ATAC-seq)
    • Reduced Representation Bisulfite Sequencing (RRBS)

    Proteomics

    • Quantitative Proteomics New!
    • PTM Proteomics New!
    • Olink Proteomics New!

    Metabolomics

    • Untargeted Metabolomics

    Premade Library

    • Sequencing Only on Illumina Sequencer
    • Sequencing Only on Ultima Sequencer
  • PromotionsPromotions
    • Platforms
    • Service & Support
    • Automated Delivery Platform (Falcon)
    • Bioinformatics Analysis Tool (NovoMagic)
    • Customer Service System (CSS)
    • Case Study
    • Blog
    • Webinar
    • Brochure
    • Cancer Research
    • Immuno-oncology
    • Agrigenomics
    • Environment
    • Food Science
    • Human Microbiome
    • Plant and Animal Microbiome
    • Drug Discovery and Development
    • Rare and Complex Diseases
    • About Us
    • Our Locations
    • News & Events
    • Careers
  • Contact UsContact Us
    • mRNA Sequencing
    • Illumina Lane Sequencing

ServicesServices menu

CompanyCompany menu

Contact UsContact Us menu

Service SupportService Support menu

Services
mRNA SequencingSwift & Express mRNA SequencingTotal RNA SequencingHuman Whole Genome SequencingWhole Exome Sequencing10x Single Cell Gene ExpressionIllumina PIP-seq Single Cell 3’ RNA SequencingSpatial Transcriptomics SequencingWhole Genome Bisulfite Sequencing (WGBS)Quantitative ProteomicsUntargeted MetabolomicsShotgun Metagenomics SequencingMetatranscriptome SequencingSequencing Only on Illumina SequencerSequencing Only on Ultima SequencerFull-Length Transcriptome SequencingChromatin Immunoprecipitation Sequencing (ChIP-seq)
Company
About UsOur LocationsNews & EventsCareers
Contact Us
Contact Us
Service Support
Automated Delivery Platform (Falcon)Bioinformatics Analysis Tool (NovoMagic)Customer Service System (CSS)
LinkedInLinkedIn hoverYouTubeYouTube hoverXX hoverMetaMeta hoverInstagramInstagram hover
Copyright © 2026 Novogene Corporation Inc. All rights reserved. For Research Use Only.
banner laptop bg
banner mobile bg

PTM Proteomics

PTM proteomics systematically characterizes the types, sites, and dynamics of protein post-translational modifications across the proteome. Deep phosphoproteomics provides large-scale quantiatitative analysis of protein phosphorylation sites and is a useful tool to define signaling network regulation and dysregulation.
OverviewOverview
BenefitsBenefits
ApplicationsApplications
SpecificationsSpecifications
ResourcesResources

Protein phosphorylation is one of the most common and important PTMs. This reversible mechanism occurs through protein kinases and consists of the addition of a phosphate group (PO4) to the polar group R of various amino acids (eg. serine/S, threonine/T, or tyrosine/Y). Phosphorylation is the primary mechanism driving cellular signal transduction. It governs everything from cell cycle progression, apoptosis, and growth to complex metabolic regulation and immune responses. Mapping these systems is a cornerstone of biomedical research.


Novogene provides deep phosphoproteomics services with the Obitrap Astral platform with a throughput of 60 samples per day (60 SPD).The workflow encompasses protein extraction, digestion, enrichment, desalting, instrumental analysis, and data processing with a turnaround time of 4 weeks.


Why Choose Novogene for Your PTM Proteomics Needs?

Deep & High-Accuracy PTM Site IdentificationDeep & High-Accuracy PTM Site Identification
Deep & High-Accuracy PTM Site Identification

In-depth analysis of PTMs that decodes "dark matter" of life regulation with increased depth of site identification and Improved accuracy of site identification (Class I sites ≥ 90%).

Deep & High-Accuracy PTM Site Identification

In-depth analysis of PTMs that decodes "dark matter" of life regulation with increased depth of site identification and Improved accuracy of site identification (Class I sites ≥ 90%).

Precise Modification Localization & Dynamic QuantificationPrecise Modification Localization & Dynamic Quantification
Precise Modification Localization & Dynamic Quantification

Multi-dimensional analysis and annotation that precisely localizes modification sites and quantifies dynamic fluctuations.

Precise Modification Localization & Dynamic Quantification

Multi-dimensional analysis and annotation that precisely localizes modification sites and quantifies dynamic fluctuations.

Multi-Dimensional Functional Decoding of PTMsMulti-Dimensional Functional Decoding of PTMs
Multi-Dimensional Functional Decoding of PTMs

Multi-dimensional functional decoding through the analysis of domains, kinase prediction, interaction networks, disease associations, etc. to transform high-dimensional data into functional catalogues.

Multi-Dimensional Functional Decoding of PTMs

Multi-dimensional functional decoding through the analysis of domains, kinase prediction, interaction networks, disease associations, etc. to transform high-dimensional data into functional catalogues.

Why Choose Novogene for Your PTM Proteomics Needs?

Deep & High-Accuracy PTM Site IdentificationDeep & High-Accuracy PTM Site Identification
Deep & High-Accuracy PTM Site Identification

In-depth analysis of PTMs that decodes "dark matter" of life regulation with increased depth of site identification and Improved accuracy of site identification (Class I sites ≥ 90%).

Deep & High-Accuracy PTM Site Identification

In-depth analysis of PTMs that decodes "dark matter" of life regulation with increased depth of site identification and Improved accuracy of site identification (Class I sites ≥ 90%).

Precise Modification Localization & Dynamic QuantificationPrecise Modification Localization & Dynamic Quantification
Precise Modification Localization & Dynamic Quantification

Multi-dimensional analysis and annotation that precisely localizes modification sites and quantifies dynamic fluctuations.

Precise Modification Localization & Dynamic Quantification

Multi-dimensional analysis and annotation that precisely localizes modification sites and quantifies dynamic fluctuations.

Multi-Dimensional Functional Decoding of PTMsMulti-Dimensional Functional Decoding of PTMs
Multi-Dimensional Functional Decoding of PTMs

Multi-dimensional functional decoding through the analysis of domains, kinase prediction, interaction networks, disease associations, etc. to transform high-dimensional data into functional catalogues.

Multi-Dimensional Functional Decoding of PTMs

Multi-dimensional functional decoding through the analysis of domains, kinase prediction, interaction networks, disease associations, etc. to transform high-dimensional data into functional catalogues.

Applications

Novogene delivers high-quality data and publication-ready analysis results of deep phosphoproteomics to faciliate research including:

Regulation of protein function

PTMs precisely control protein activity, stability, localization, and interactions. This allows cells to dynamically fine-tune protein behavior in response to stimuli, regulating essential processes from signal transduction and metabolism to gene expression.

Regulation of protein function

PTMs precisely control protein activity, stability, localization, and interactions. This allows cells to dynamically fine-tune protein behavior in response to stimuli, regulating essential processes from signal transduction and metabolism to gene expression.

Enzyme regulation

PTMs directly regulate enzyme activity. For instance, phosphorylation can activate or inhibit catalytic function, thereby controlling key cellular signaling and metabolic pathways.

Enzyme regulation

PTMs directly regulate enzyme activity. For instance, phosphorylation can activate or inhibit catalytic function, thereby controlling key cellular signaling and metabolic pathways.

Cell signaling

PTMs are central to cellular communication. Modifications (like phosphorylation) act as molecular switches that turn proteins "on" or "off," enabling cells to relay and respond to signals effectively.

Cell signaling

PTMs are central to cellular communication. Modifications (like phosphorylation) act as molecular switches that turn proteins "on" or "off," enabling cells to relay and respond to signals effectively.

Disease biomarkers

Aberrant PTM patterns are directly linked to diseases such as cancer and neurodegenerative disorders. Detecting these altered PTMs provides valuable biomarkers for improved diagnosis, prognosis, and drug target identification.

Disease biomarkers

Aberrant PTM patterns are directly linked to diseases such as cancer and neurodegenerative disorders. Detecting these altered PTMs provides valuable biomarkers for improved diagnosis, prognosis, and drug target identification.

Drug development

Understanding PTMs enables the design of targeted therapies. Modifying specific PTMs can restore normal protein function and cellular processes, presenting promising new therapeutic strategies.

Drug development

Understanding PTMs enables the design of targeted therapies. Modifying specific PTMs can restore normal protein function and cellular processes, presenting promising new therapeutic strategies.

Applications

Novogene delivers high-quality data and publication-ready analysis results of deep phosphoproteomics to faciliate research including:

Regulation of protein function

PTMs precisely control protein activity, stability, localization, and interactions. This allows cells to dynamically fine-tune protein behavior in response to stimuli, regulating essential processes from signal transduction and metabolism to gene expression.

Regulation of protein function

PTMs precisely control protein activity, stability, localization, and interactions. This allows cells to dynamically fine-tune protein behavior in response to stimuli, regulating essential processes from signal transduction and metabolism to gene expression.

Enzyme regulation

PTMs directly regulate enzyme activity. For instance, phosphorylation can activate or inhibit catalytic function, thereby controlling key cellular signaling and metabolic pathways.

Enzyme regulation

PTMs directly regulate enzyme activity. For instance, phosphorylation can activate or inhibit catalytic function, thereby controlling key cellular signaling and metabolic pathways.

Cell signaling

PTMs are central to cellular communication. Modifications (like phosphorylation) act as molecular switches that turn proteins "on" or "off," enabling cells to relay and respond to signals effectively.

Cell signaling

PTMs are central to cellular communication. Modifications (like phosphorylation) act as molecular switches that turn proteins "on" or "off," enabling cells to relay and respond to signals effectively.

Disease biomarkers

Aberrant PTM patterns are directly linked to diseases such as cancer and neurodegenerative disorders. Detecting these altered PTMs provides valuable biomarkers for improved diagnosis, prognosis, and drug target identification.

Disease biomarkers

Aberrant PTM patterns are directly linked to diseases such as cancer and neurodegenerative disorders. Detecting these altered PTMs provides valuable biomarkers for improved diagnosis, prognosis, and drug target identification.

Drug development

Understanding PTMs enables the design of targeted therapies. Modifying specific PTMs can restore normal protein function and cellular processes, presenting promising new therapeutic strategies.

Drug development

Understanding PTMs enables the design of targeted therapies. Modifying specific PTMs can restore normal protein function and cellular processes, presenting promising new therapeutic strategies.

Specifications

Sample Requirements

Sample amounts are listed for reference only. Download the Sample Submission Guidelines to learn more. For detailed information, please contact us with your customized requests.

Sample TypeAmount
Animal tissuesGeneral tissue (brain, heart, liver, spleen, lung, kidney, muscle, etc.)100 mg
Plant tissuesSoft tissues (leaves, flowers, algae, ferns, etc.)500 mg
Fruit pulp1 g
Seeds5 g
Pollen4 g
CellsSuspension/Adherent cultured cells400 μL
MicroorganismsCommon bacteria2×107 (50 μL cell pellet)
Fungal mycelium200 mg or 200 μL pellet

Sample Requirements

Sample amounts are listed for reference only. Download the Sample Submission Guidelines to learn more. For detailed information, please contact us with your customized requests.

Sample TypeAmount
Animal tissuesGeneral tissue (brain, heart, liver, spleen, lung, kidney, muscle, etc.)100 mg
Plant tissuesSoft tissues (leaves, flowers, algae, ferns, etc.)500 mg
Fruit pulp1 g
Seeds5 g
Pollen4 g
CellsSuspension/Adherent cultured cells400 μL
MicroorganismsCommon bacteria2×107 (50 μL cell pellet)
Fungal mycelium200 mg or 200 μL pellet

Sample Requirements

Sample amounts are listed for reference only. Download the Sample Submission Guidelines to learn more. For detailed information, please contact us with your customized requests.

Sample TypeAmount
Animal tissuesGeneral tissue (brain, heart, liver, spleen, lung, kidney, muscle, etc.)100 mg
Plant tissuesSoft tissues (leaves, flowers, algae, ferns, etc.)500 mg
Fruit pulp1 g
Seeds5 g
Pollen4 g
CellsSuspension/Adherent cultured cells400 μL
MicroorganismsCommon bacteria2×107 (50 μL cell pellet)
Fungal mycelium200 mg or 200 μL pellet

Sample Requirements

Sample amounts are listed for reference only. Download the Sample Submission Guidelines to learn more. For detailed information, please contact us with your customized requests.

Sample TypeAmount
Animal tissuesGeneral tissue (brain, heart, liver, spleen, lung, kidney, muscle, etc.)100 mg
Plant tissuesSoft tissues (leaves, flowers, algae, ferns, etc.)500 mg
Fruit pulp1 g
Seeds5 g
Pollen4 g
CellsSuspension/Adherent cultured cells400 μL
MicroorganismsCommon bacteria2×107 (50 μL cell pellet)
Fungal mycelium200 mg or 200 μL pellet

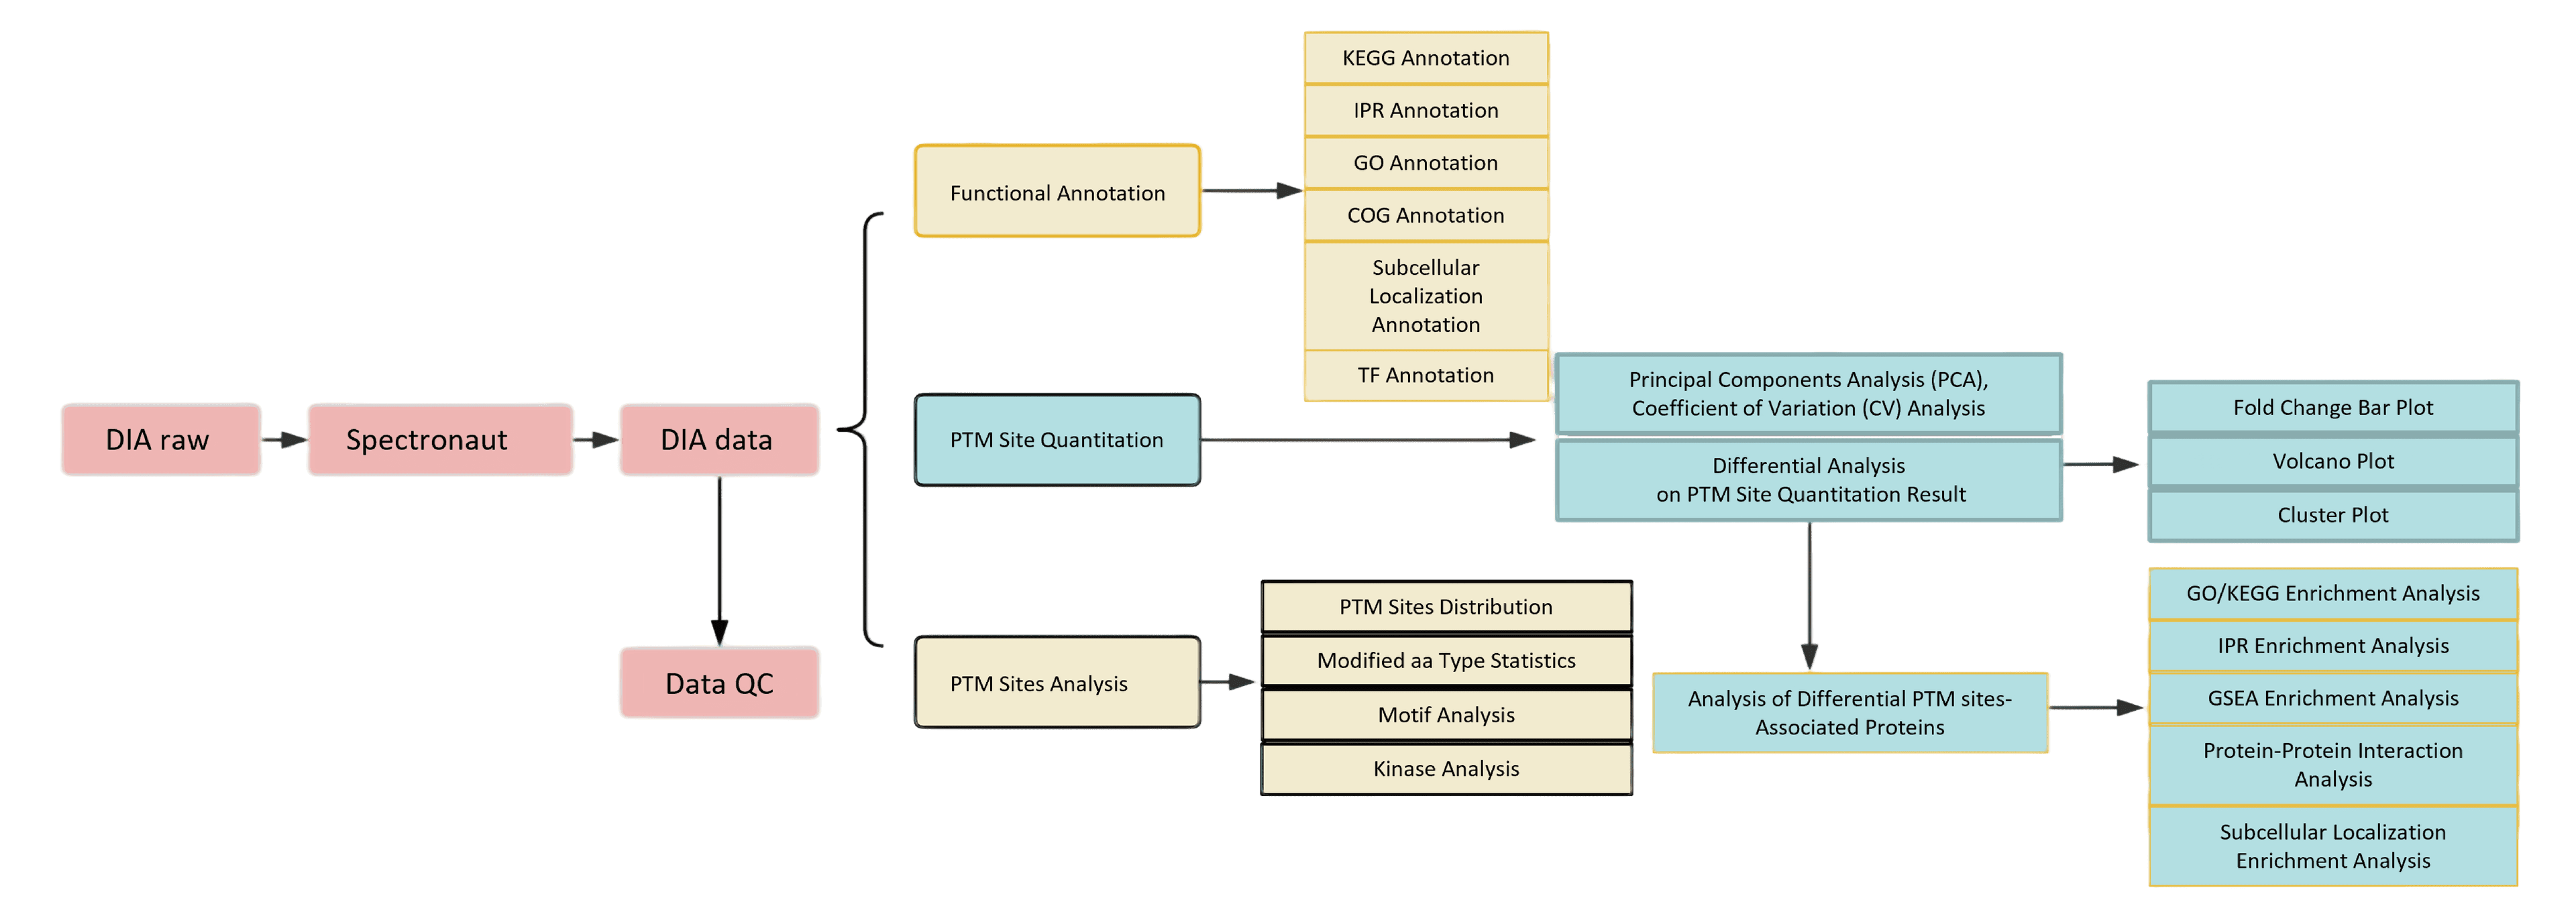
Overview of Data Processing and Bioinformatic Analysis

Recommended data outputs and analysis contents displayed are for reference only. For detailed information, please contact us with your customized requests.

Overview of Data Processing and Bioinformatic Analysis

Overview of Data Processing and Bioinformatic Analysis

Recommended data outputs and analysis contents displayed are for reference only. For detailed information, please contact us with your customized requests.

Overview of Data Processing and Bioinformatic Analysis

Overview of Data Processing and Bioinformatic Analysis

Recommended data outputs and analysis contents displayed are for reference only. For detailed information, please contact us with your customized requests.

Overview of Data Processing and Bioinformatic Analysis

Overview of Data Processing and Bioinformatic Analysis

Recommended data outputs and analysis contents displayed are for reference only. For detailed information, please contact us with your customized requests.

Overview of Data Processing and Bioinformatic Analysis

Project Workflow

Novogene provides high-quality products and expert services throughout the entire project workflow. From sample preparation to data acquisition, every step in the process-including protein extraction, quantification, detection, enzymatic digestion, modified peptide enrichment and desalting, and mass spectrometry analysis can influence the quality of the data. To ensure accurate and reliable results, Novogene maintains tight control over each step, fundamentally safeguarding data quality. The experimental workflow is provided below.

Project Workflow

Project Workflow

Novogene provides high-quality products and expert services throughout the entire project workflow. From sample preparation to data acquisition, every step in the process-including protein extraction, quantification, detection, enzymatic digestion, modified peptide enrichment and desalting, and mass spectrometry analysis can influence the quality of the data. To ensure accurate and reliable results, Novogene maintains tight control over each step, fundamentally safeguarding data quality. The experimental workflow is provided below.

Project Workflow

Project Workflow

Novogene provides high-quality products and expert services throughout the entire project workflow. From sample preparation to data acquisition, every step in the process-including protein extraction, quantification, detection, enzymatic digestion, modified peptide enrichment and desalting, and mass spectrometry analysis can influence the quality of the data. To ensure accurate and reliable results, Novogene maintains tight control over each step, fundamentally safeguarding data quality. The experimental workflow is provided below.

Project Workflow

Project Workflow

Novogene provides high-quality products and expert services throughout the entire project workflow. From sample preparation to data acquisition, every step in the process-including protein extraction, quantification, detection, enzymatic digestion, modified peptide enrichment and desalting, and mass spectrometry analysis can influence the quality of the data. To ensure accurate and reliable results, Novogene maintains tight control over each step, fundamentally safeguarding data quality. The experimental workflow is provided below.

Project Workflow

Specifications

Sample Requirements

Sample amounts are listed for reference only. Download the Sample Submission Guidelines to learn more. For detailed information, please contact us with your customized requests.

Sample TypeAmount
Animal tissuesGeneral tissue (brain, heart, liver, spleen, lung, kidney, muscle, etc.)100 mg
Plant tissuesSoft tissues (leaves, flowers, algae, ferns, etc.)500 mg
Fruit pulp1 g
Seeds5 g
Pollen4 g
CellsSuspension/Adherent cultured cells400 μL
MicroorganismsCommon bacteria2×107 (50 μL cell pellet)
Fungal mycelium200 mg or 200 μL pellet

Sample Requirements

Sample amounts are listed for reference only. Download the Sample Submission Guidelines to learn more. For detailed information, please contact us with your customized requests.

Sample TypeAmount
Animal tissuesGeneral tissue (brain, heart, liver, spleen, lung, kidney, muscle, etc.)100 mg
Plant tissuesSoft tissues (leaves, flowers, algae, ferns, etc.)500 mg
Fruit pulp1 g
Seeds5 g
Pollen4 g
CellsSuspension/Adherent cultured cells400 μL
MicroorganismsCommon bacteria2×107 (50 μL cell pellet)
Fungal mycelium200 mg or 200 μL pellet

Sample Requirements

Sample amounts are listed for reference only. Download the Sample Submission Guidelines to learn more. For detailed information, please contact us with your customized requests.

Sample TypeAmount
Animal tissuesGeneral tissue (brain, heart, liver, spleen, lung, kidney, muscle, etc.)100 mg
Plant tissuesSoft tissues (leaves, flowers, algae, ferns, etc.)500 mg
Fruit pulp1 g
Seeds5 g
Pollen4 g
CellsSuspension/Adherent cultured cells400 μL
MicroorganismsCommon bacteria2×107 (50 μL cell pellet)
Fungal mycelium200 mg or 200 μL pellet

Sample Requirements

Sample amounts are listed for reference only. Download the Sample Submission Guidelines to learn more. For detailed information, please contact us with your customized requests.

Sample TypeAmount
Animal tissuesGeneral tissue (brain, heart, liver, spleen, lung, kidney, muscle, etc.)100 mg
Plant tissuesSoft tissues (leaves, flowers, algae, ferns, etc.)500 mg
Fruit pulp1 g
Seeds5 g
Pollen4 g
CellsSuspension/Adherent cultured cells400 μL
MicroorganismsCommon bacteria2×107 (50 μL cell pellet)
Fungal mycelium200 mg or 200 μL pellet

Overview of Data Processing and Bioinformatic Analysis

Recommended data outputs and analysis contents displayed are for reference only. For detailed information, please contact us with your customized requests.

Overview of Data Processing and Bioinformatic Analysis

Overview of Data Processing and Bioinformatic Analysis

Recommended data outputs and analysis contents displayed are for reference only. For detailed information, please contact us with your customized requests.

Overview of Data Processing and Bioinformatic Analysis

Overview of Data Processing and Bioinformatic Analysis

Recommended data outputs and analysis contents displayed are for reference only. For detailed information, please contact us with your customized requests.

Overview of Data Processing and Bioinformatic Analysis

Overview of Data Processing and Bioinformatic Analysis

Recommended data outputs and analysis contents displayed are for reference only. For detailed information, please contact us with your customized requests.

Overview of Data Processing and Bioinformatic Analysis

Project Workflow

Novogene provides high-quality products and expert services throughout the entire project workflow. From sample preparation to data acquisition, every step in the process-including protein extraction, quantification, detection, enzymatic digestion, modified peptide enrichment and desalting, and mass spectrometry analysis can influence the quality of the data. To ensure accurate and reliable results, Novogene maintains tight control over each step, fundamentally safeguarding data quality. The experimental workflow is provided below.

Project Workflow

Project Workflow

Novogene provides high-quality products and expert services throughout the entire project workflow. From sample preparation to data acquisition, every step in the process-including protein extraction, quantification, detection, enzymatic digestion, modified peptide enrichment and desalting, and mass spectrometry analysis can influence the quality of the data. To ensure accurate and reliable results, Novogene maintains tight control over each step, fundamentally safeguarding data quality. The experimental workflow is provided below.

Project Workflow

Project Workflow

Novogene provides high-quality products and expert services throughout the entire project workflow. From sample preparation to data acquisition, every step in the process-including protein extraction, quantification, detection, enzymatic digestion, modified peptide enrichment and desalting, and mass spectrometry analysis can influence the quality of the data. To ensure accurate and reliable results, Novogene maintains tight control over each step, fundamentally safeguarding data quality. The experimental workflow is provided below.

Project Workflow

Project Workflow

Novogene provides high-quality products and expert services throughout the entire project workflow. From sample preparation to data acquisition, every step in the process-including protein extraction, quantification, detection, enzymatic digestion, modified peptide enrichment and desalting, and mass spectrometry analysis can influence the quality of the data. To ensure accurate and reliable results, Novogene maintains tight control over each step, fundamentally safeguarding data quality. The experimental workflow is provided below.

Project Workflow

Resources

Image
Image
1/1
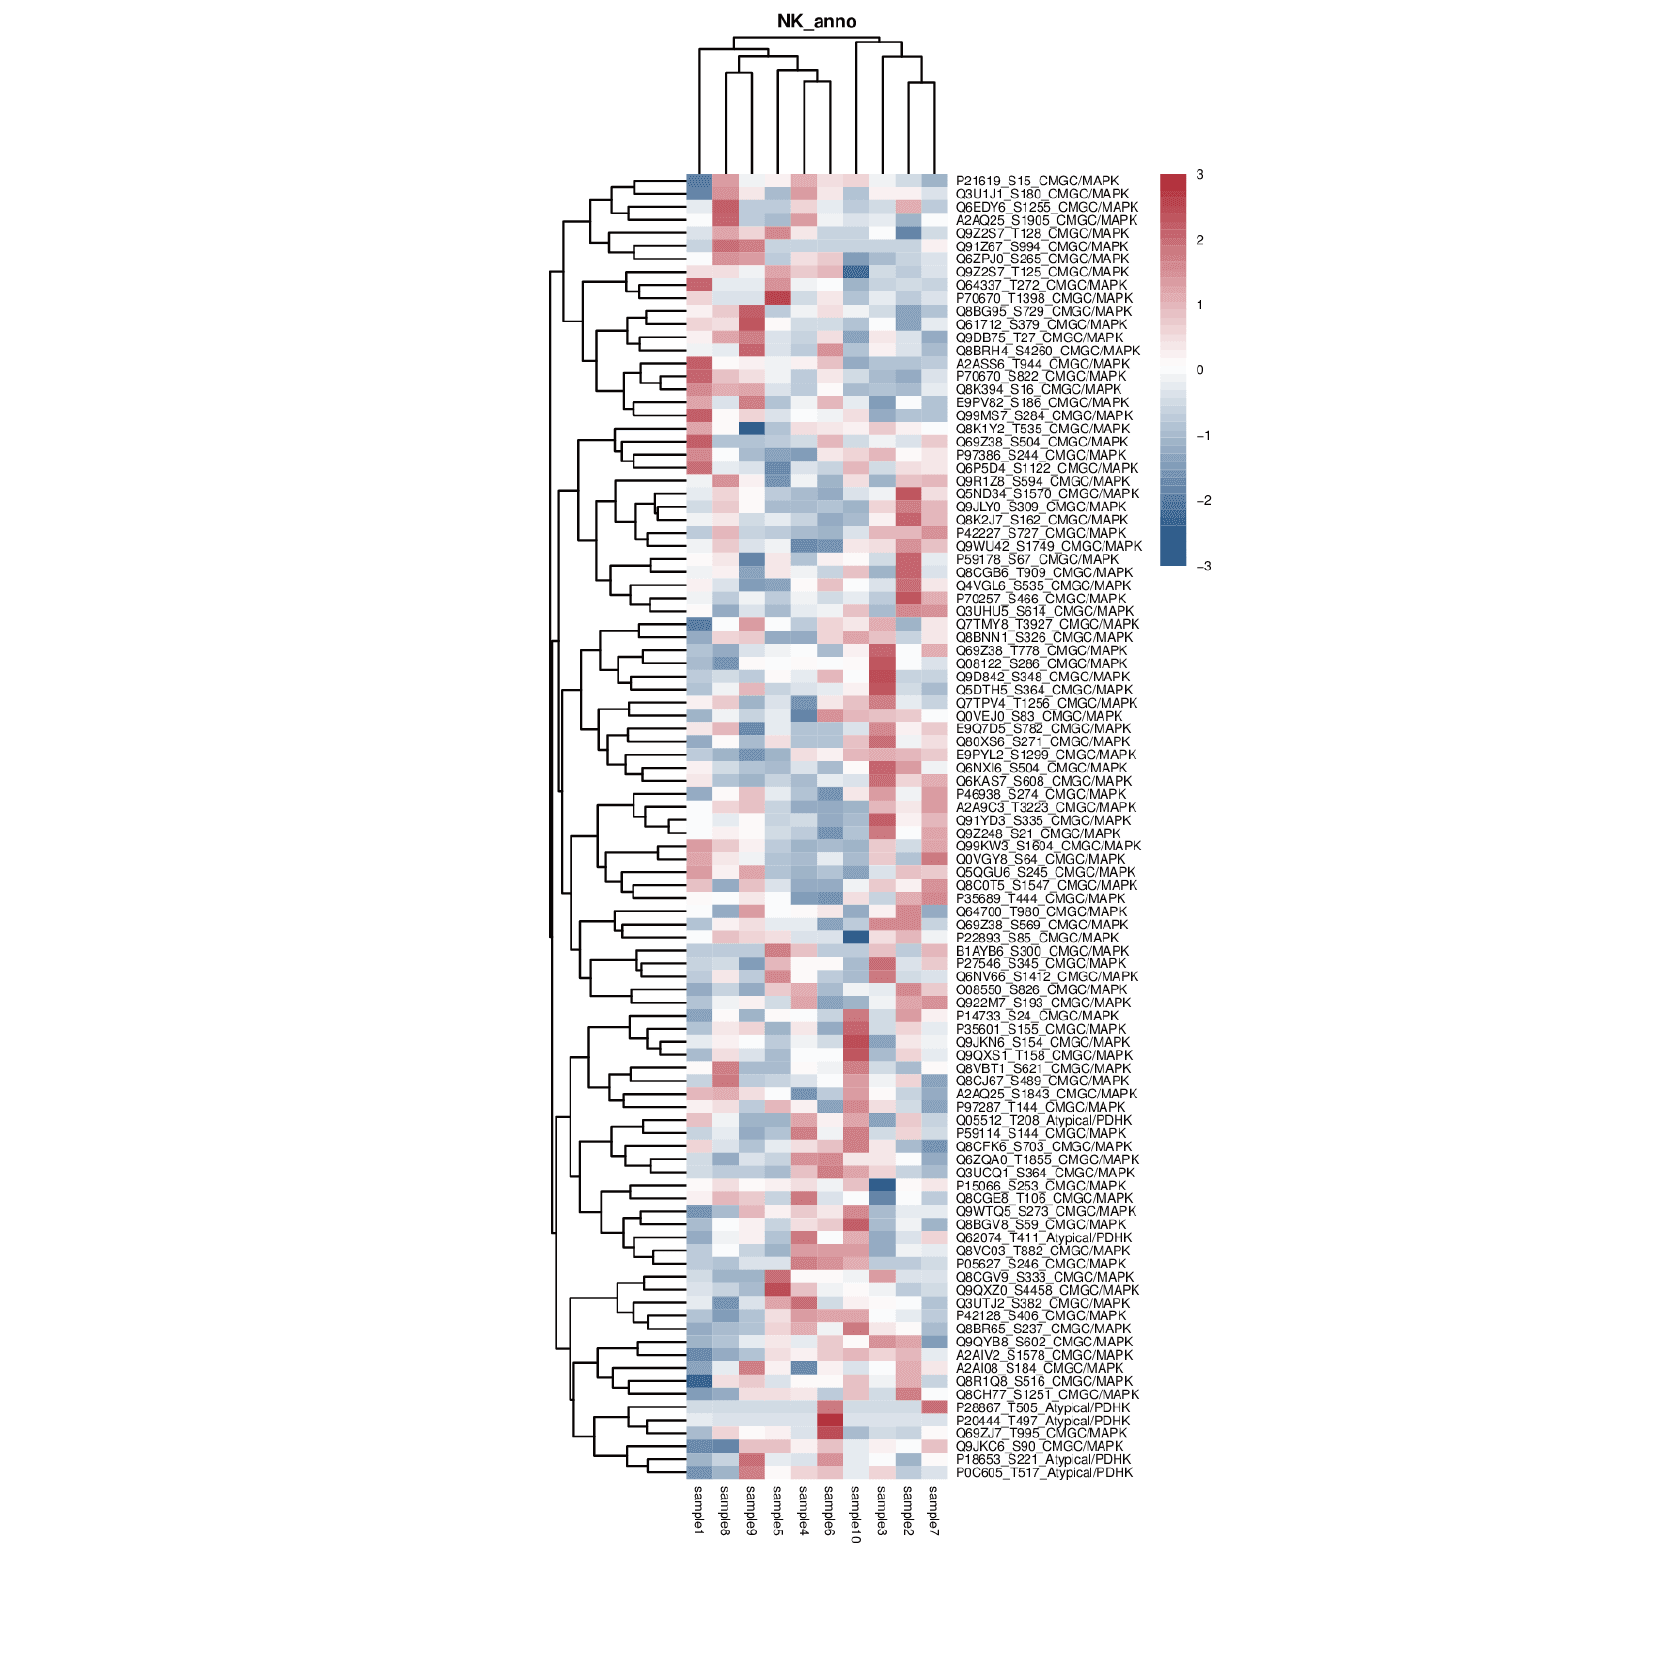
Phosphorylated kinase site expression level chart

For the identified phosphosites, the kinases involved in phosphorylation process were predicted. Top 100 kinases with the highest prediction scores were selected for quantitative analysis.

Image
Image
1/1
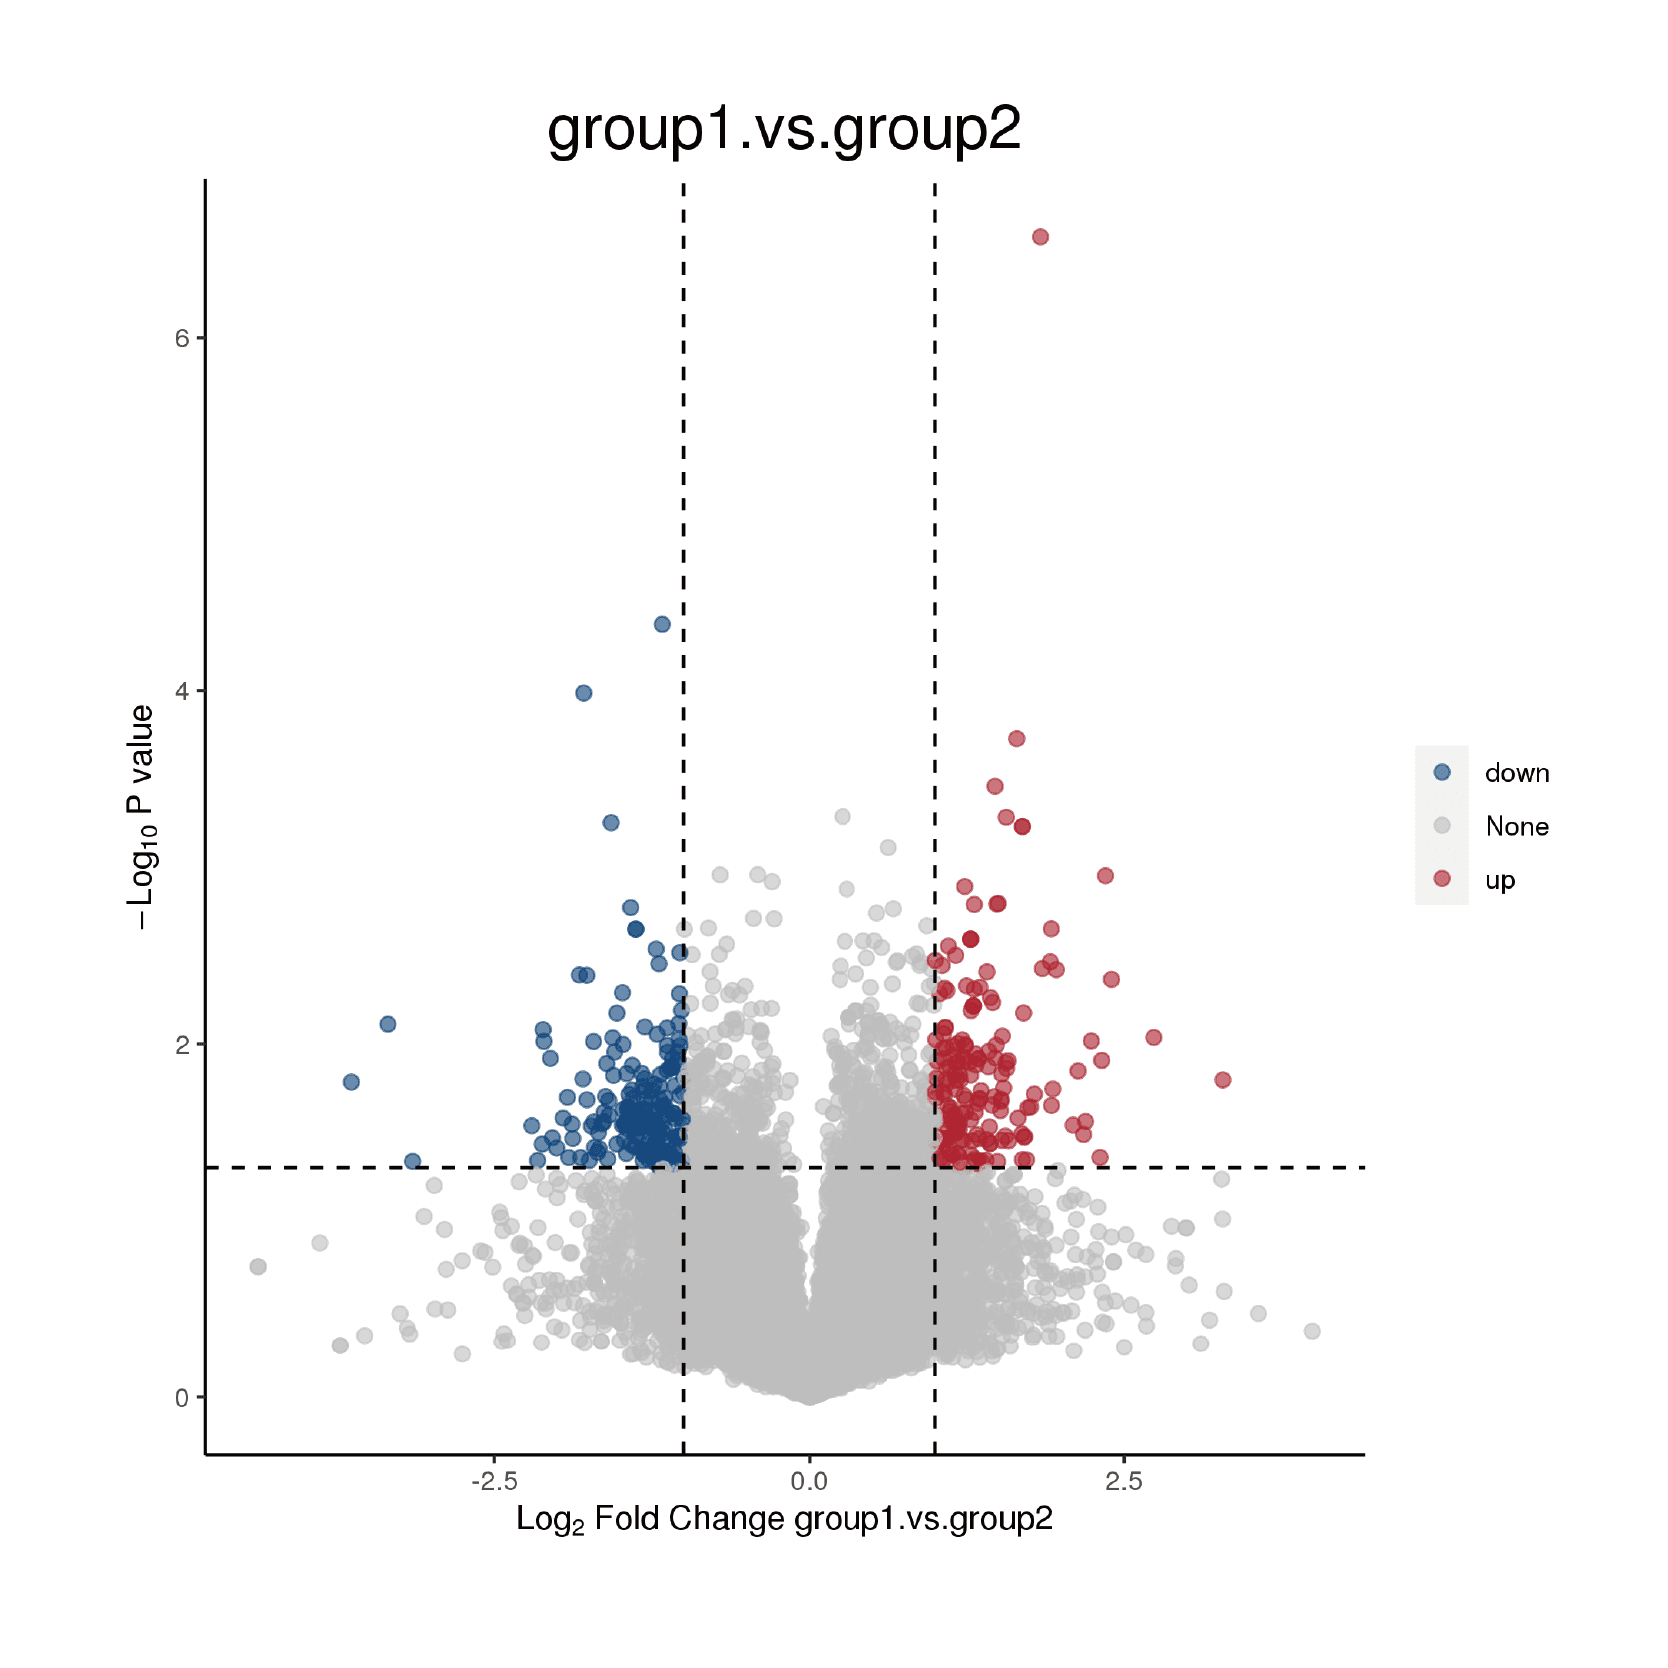
The volcano plot of the differential phosphosites

For each differential phosphosite, the fold change is taken as the log2 value, and the P-value is taken as the absolute value of the log10 value to create a volcano plot.

Image
Image
1/1
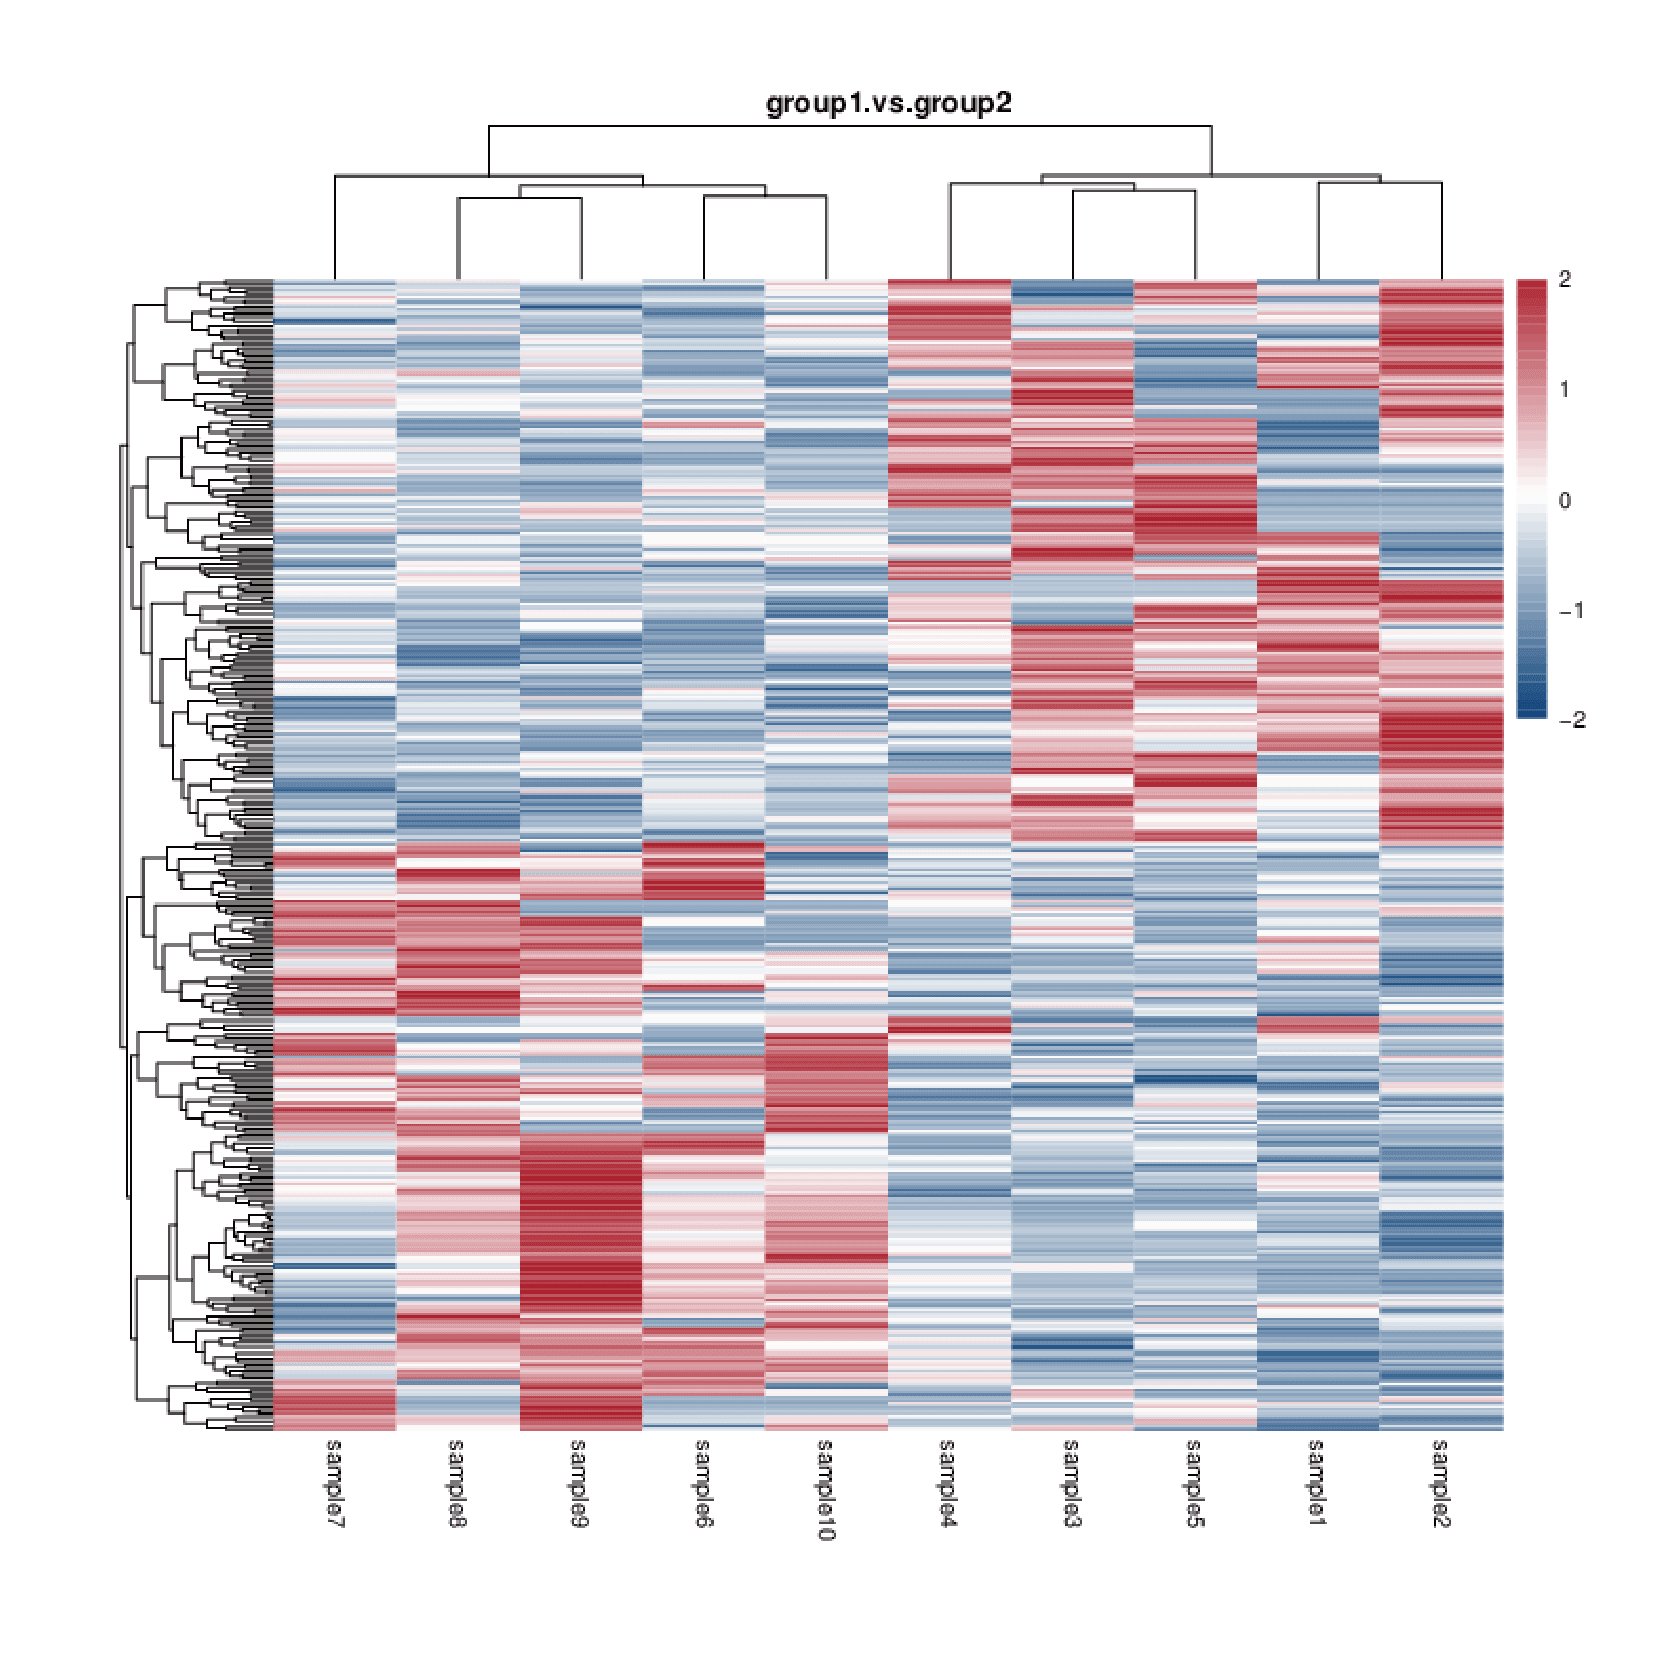
The HCA heatmap of the differential phosphosites

The HCA heatmap of the differential phosphosites. A Hierarchical Cluster Analysis (HCA) heatmap is used to illustrate the up-regulation and down-regulation of different phosphosites when comparing different samples.

Image
Image
1/1
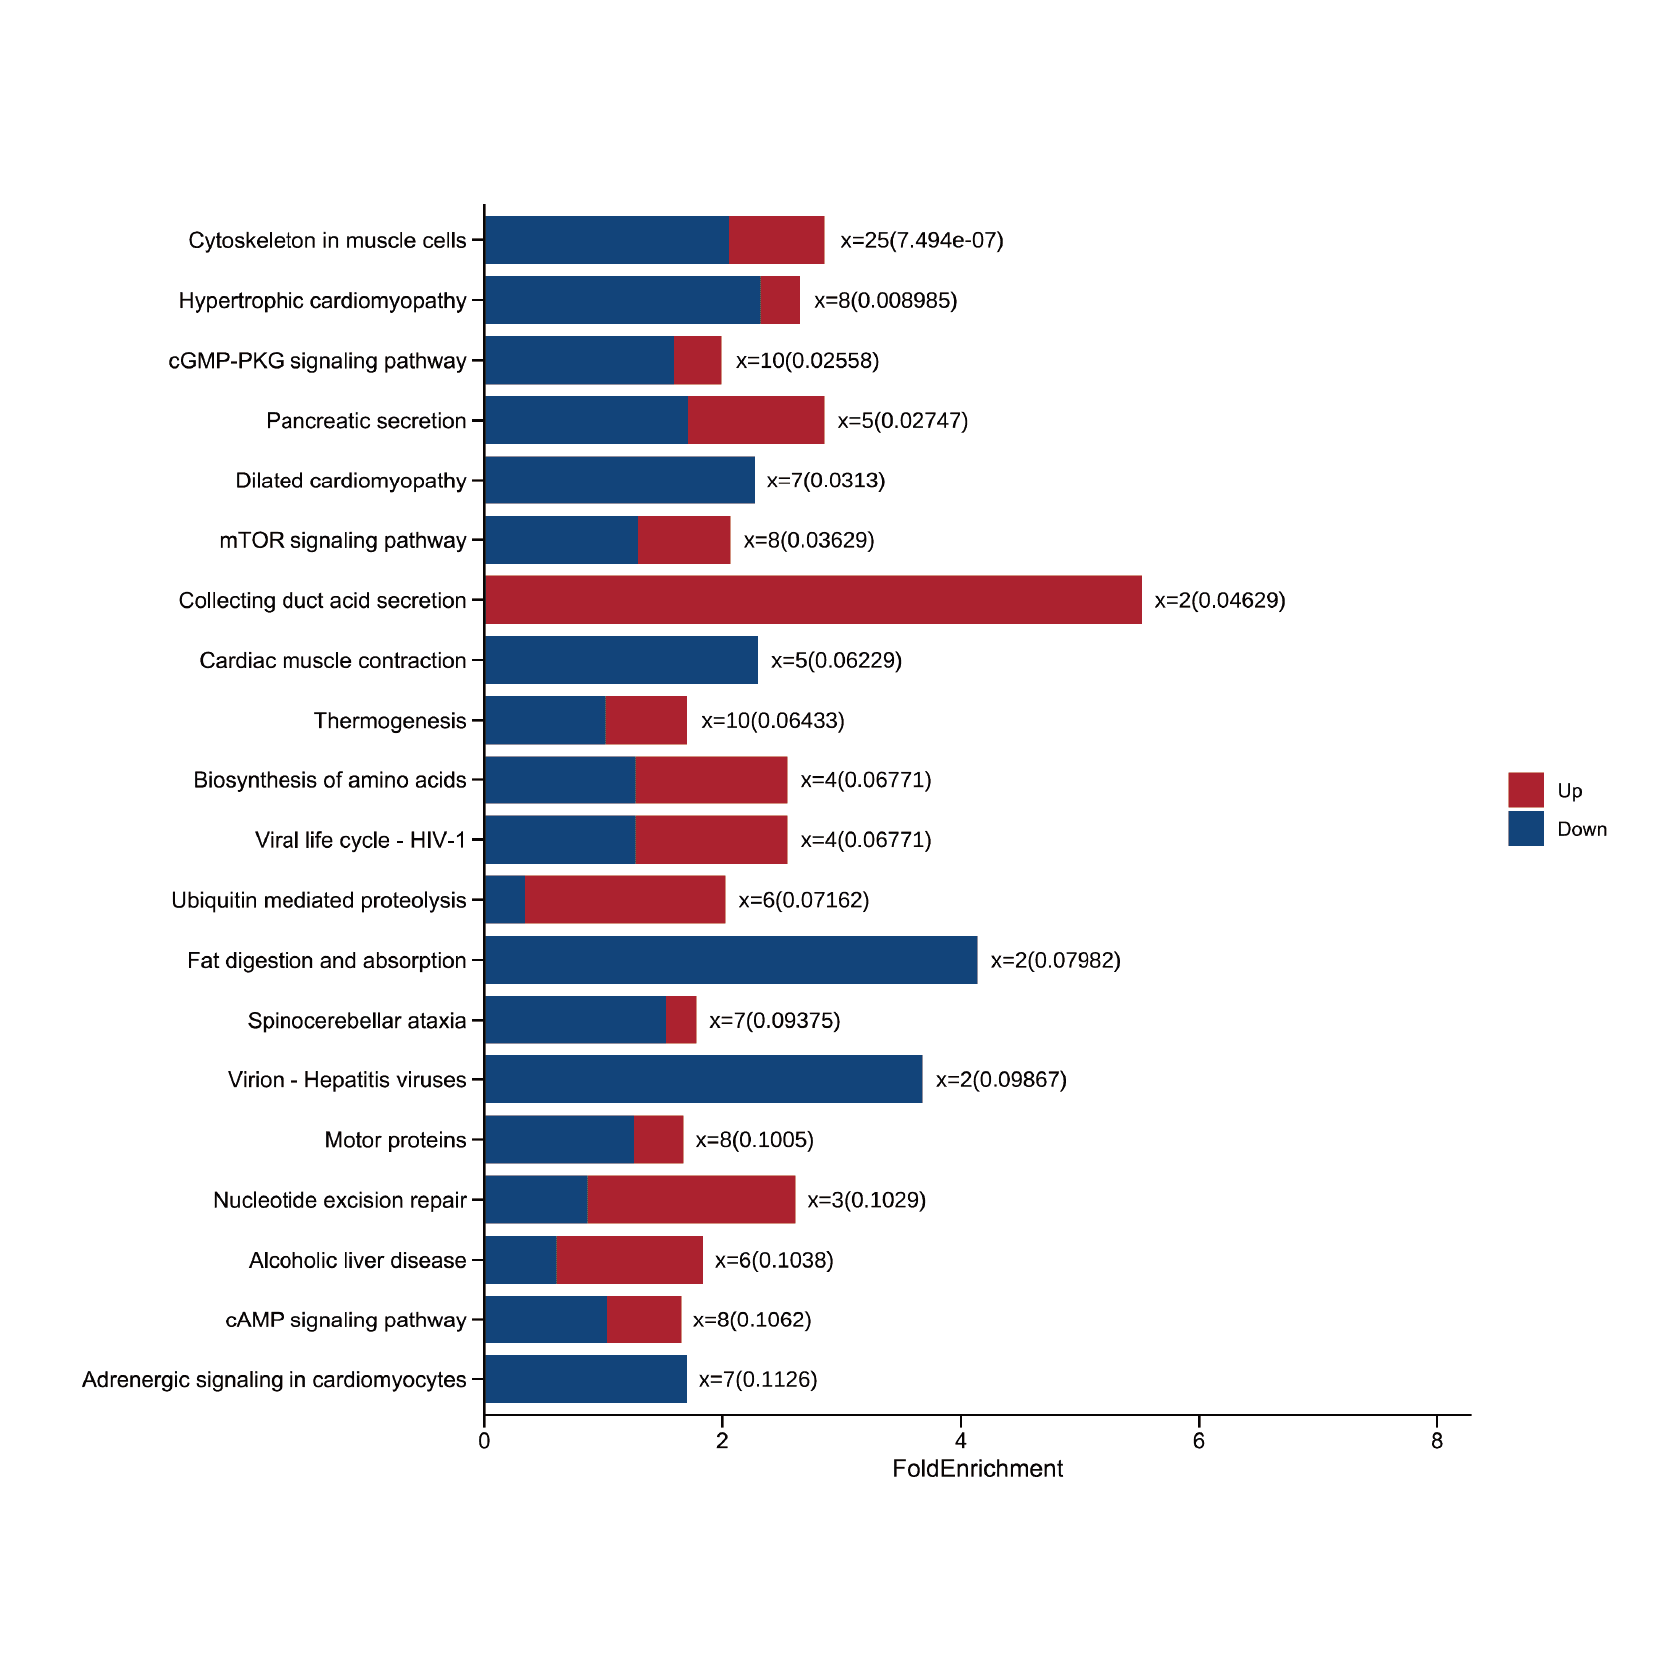
The bar chart of the number of upregulated and downregulated modification site-corresponding proteins

Based on the GO enrichment results in this project, the bar charts were plotted to compare the numbers of upregulated and downregulated proteins corresponding to the differential modification sites enriched in GO.

Image
Image
1/1
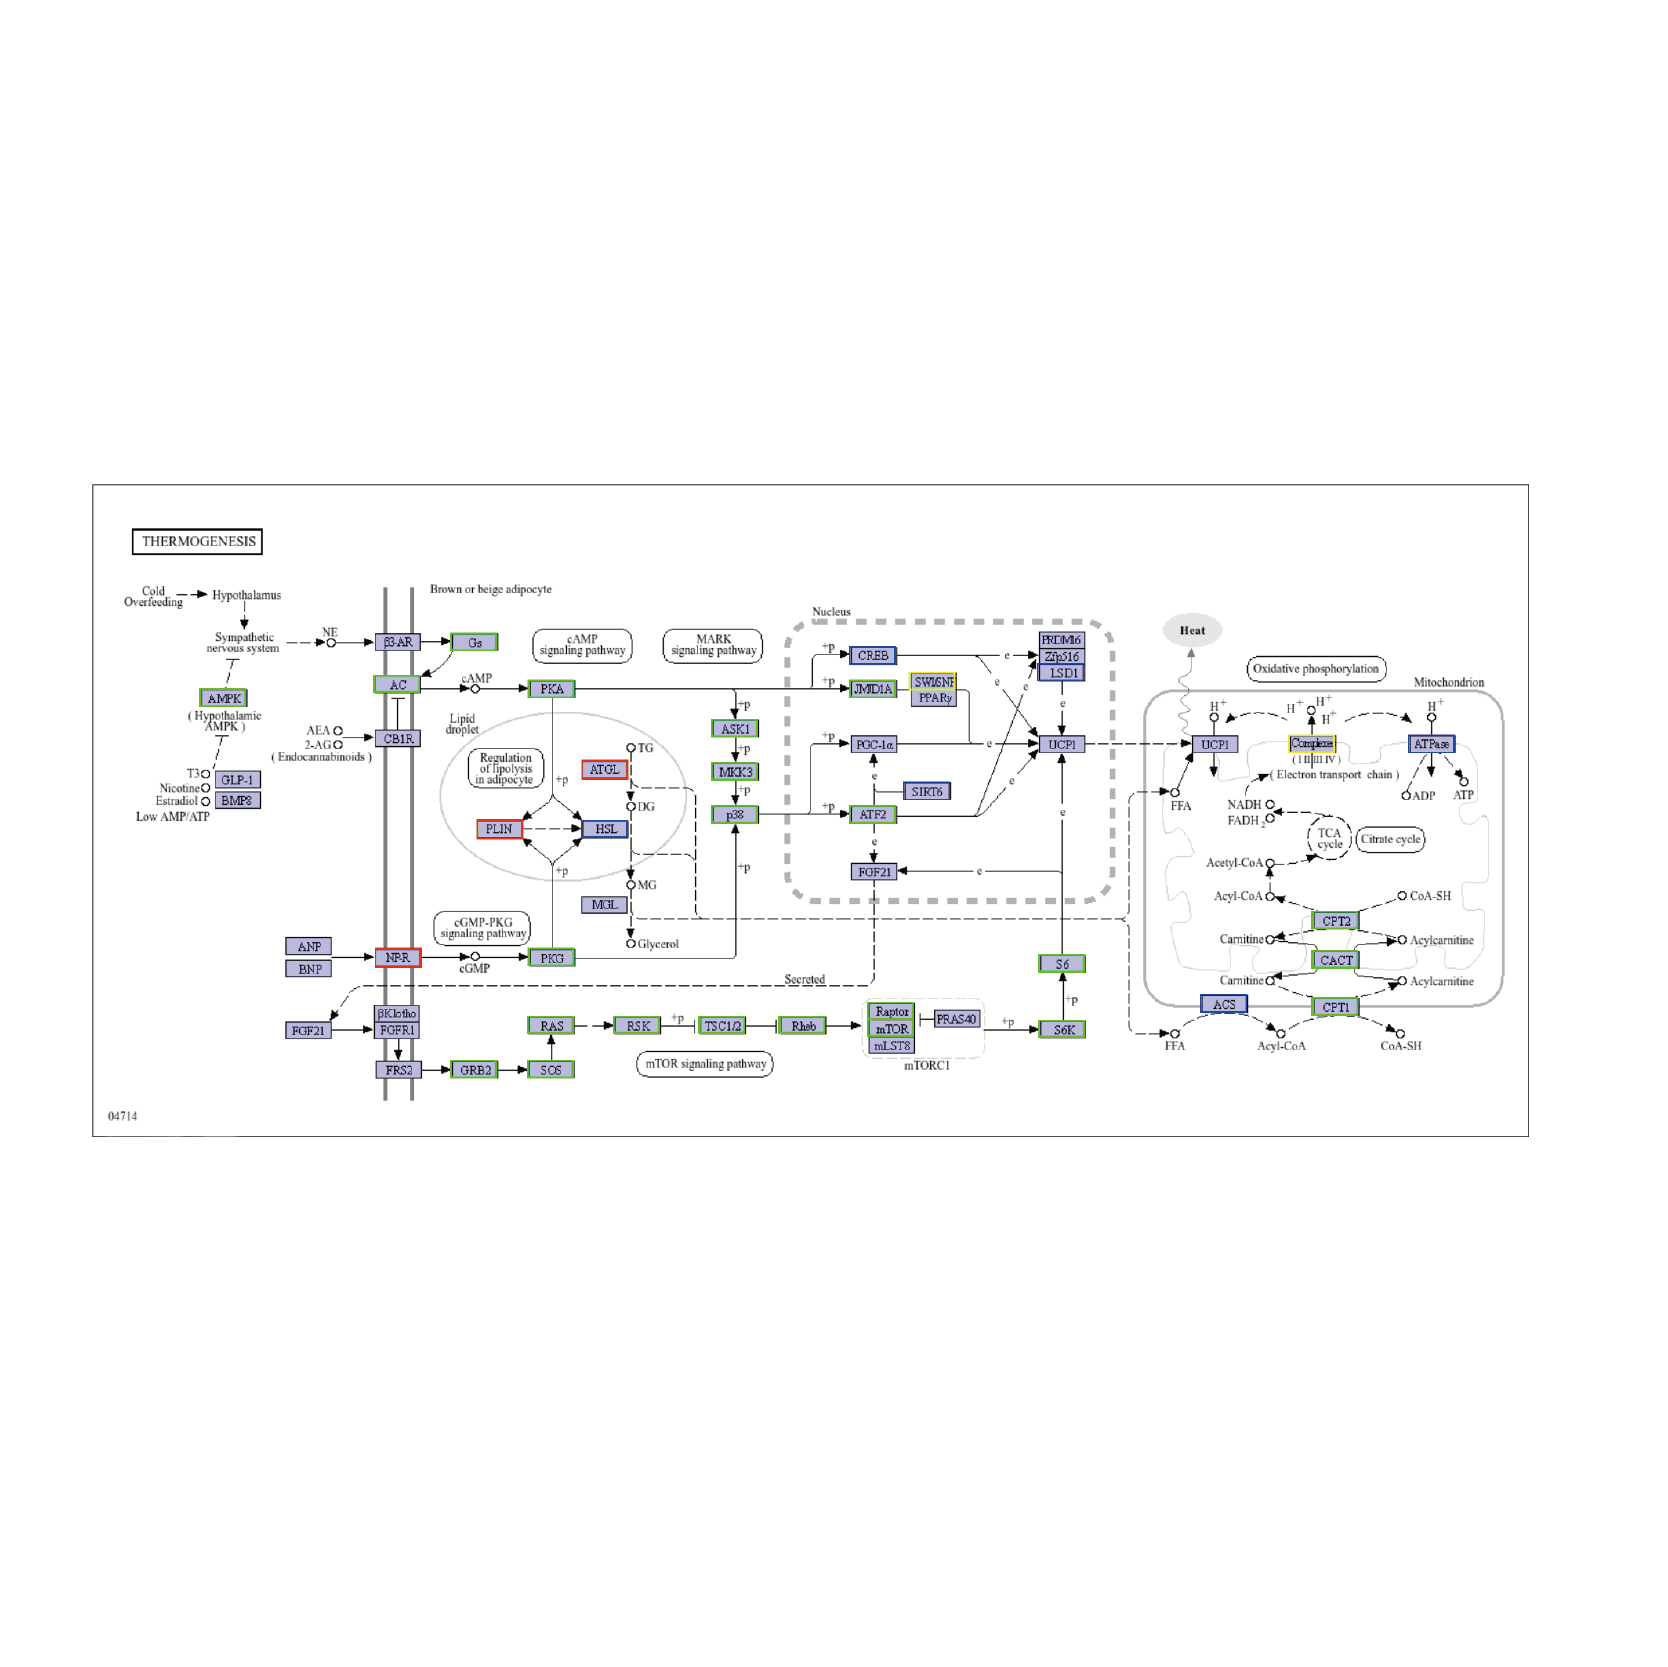
The annotation of differential phosphosite-associated proteins in enriched KEGG pathway

In the map, the differential phosphosite-associated proteins are highlighted.

Image
Image
1/1
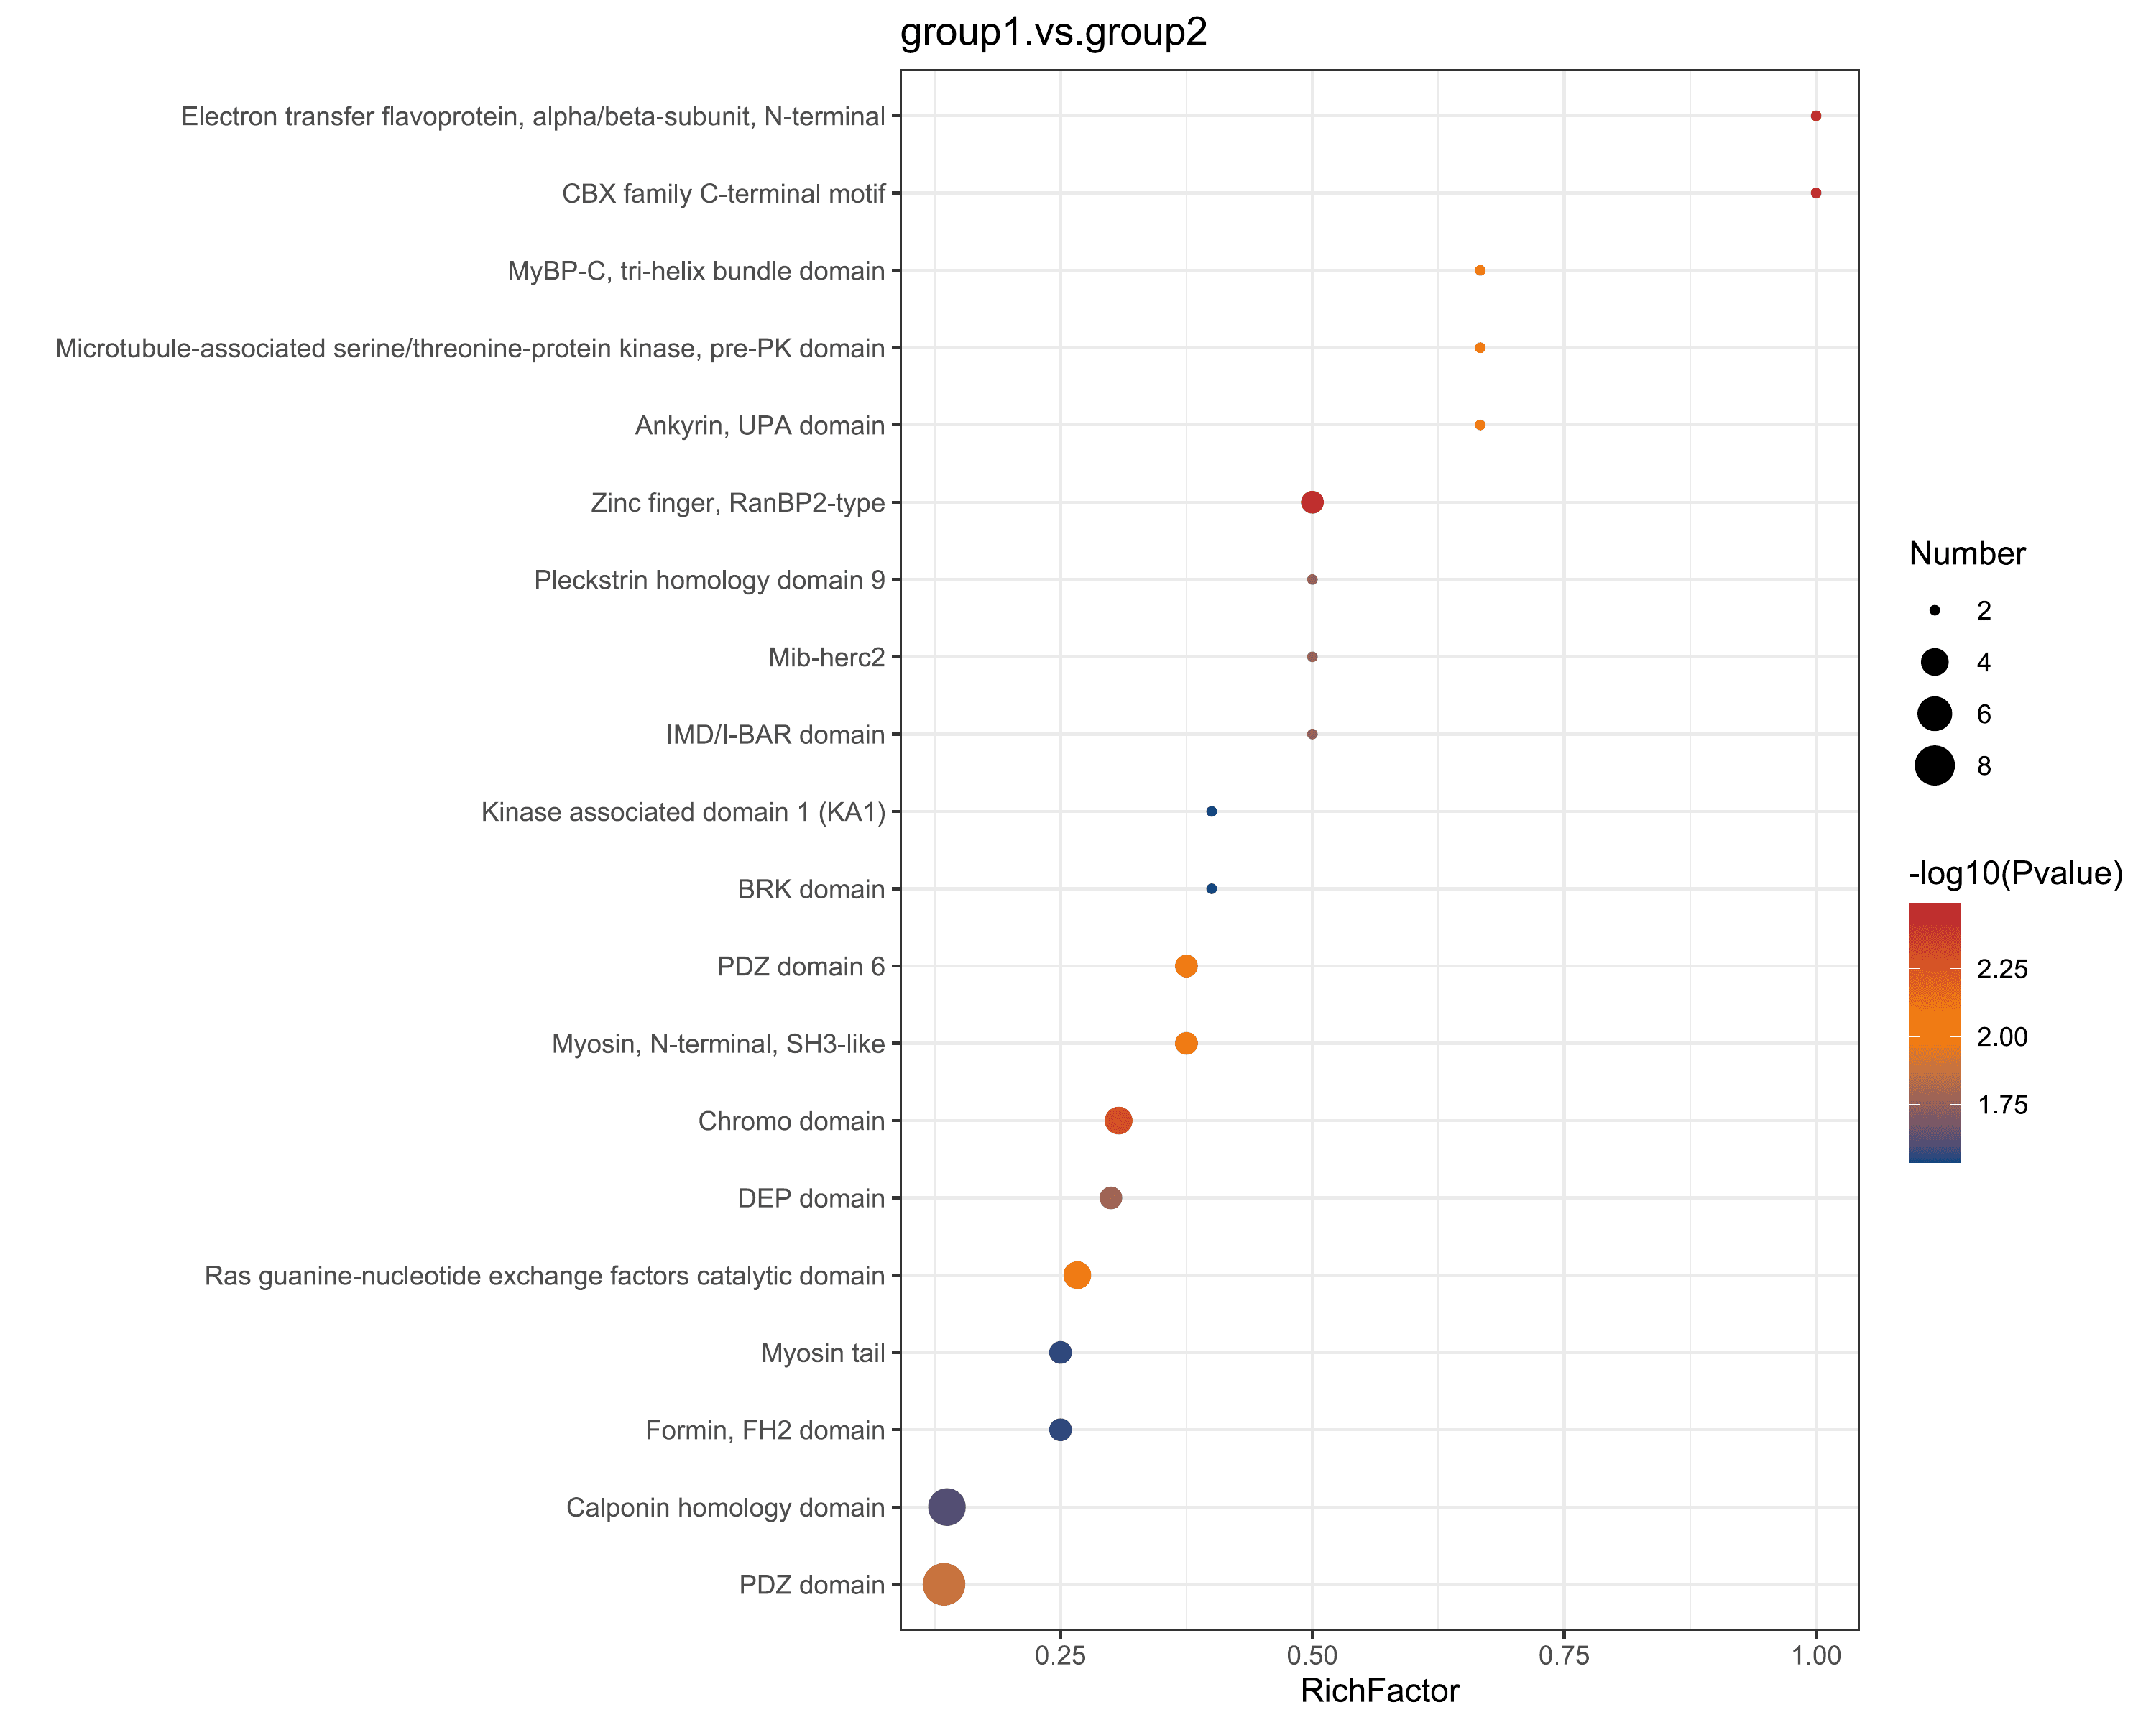
The bubble plot of domain enrichment

Protein domain enrichment analysis can identify statistically significantly enriched domain entries. These functions or locations may be the reasons for the differences.

Image
Image
1/1
Phosphorylated kinase site expression level chart

For the identified phosphosites, the kinases involved in phosphorylation process were predicted. Top 100 kinases with the highest prediction scores were selected for quantitative analysis.

Image
Image
1/1
The volcano plot of the differential phosphosites

For each differential phosphosite, the fold change is taken as the log2 value, and the P-value is taken as the absolute value of the log10 value to create a volcano plot.

Image
Image
1/1
The HCA heatmap of the differential phosphosites

The HCA heatmap of the differential phosphosites. A Hierarchical Cluster Analysis (HCA) heatmap is used to illustrate the up-regulation and down-regulation of different phosphosites when comparing different samples.

Image
Image
1/1
The bar chart of the number of upregulated and downregulated modification site-corresponding proteins

Based on the GO enrichment results in this project, the bar charts were plotted to compare the numbers of upregulated and downregulated proteins corresponding to the differential modification sites enriched in GO.

Image
Image
1/1
The annotation of differential phosphosite-associated proteins in enriched KEGG pathway

In the map, the differential phosphosite-associated proteins are highlighted.

Image
Image
1/1
The bubble plot of domain enrichment

Protein domain enrichment analysis can identify statistically significantly enriched domain entries. These functions or locations may be the reasons for the differences.

Resources

Image
Image
1/1
Phosphorylated kinase site expression level chart

For the identified phosphosites, the kinases involved in phosphorylation process were predicted. Top 100 kinases with the highest prediction scores were selected for quantitative analysis.

Image
Image
1/1
The volcano plot of the differential phosphosites

For each differential phosphosite, the fold change is taken as the log2 value, and the P-value is taken as the absolute value of the log10 value to create a volcano plot.

Image
Image
1/1
The HCA heatmap of the differential phosphosites

The HCA heatmap of the differential phosphosites. A Hierarchical Cluster Analysis (HCA) heatmap is used to illustrate the up-regulation and down-regulation of different phosphosites when comparing different samples.

Image
Image
1/1
The bar chart of the number of upregulated and downregulated modification site-corresponding proteins

Based on the GO enrichment results in this project, the bar charts were plotted to compare the numbers of upregulated and downregulated proteins corresponding to the differential modification sites enriched in GO.

Image
Image
1/1
The annotation of differential phosphosite-associated proteins in enriched KEGG pathway

In the map, the differential phosphosite-associated proteins are highlighted.

Image
Image
1/1
The bubble plot of domain enrichment

Protein domain enrichment analysis can identify statistically significantly enriched domain entries. These functions or locations may be the reasons for the differences.

Image
Image
1/1
Phosphorylated kinase site expression level chart

For the identified phosphosites, the kinases involved in phosphorylation process were predicted. Top 100 kinases with the highest prediction scores were selected for quantitative analysis.

Image
Image
1/1
The volcano plot of the differential phosphosites

For each differential phosphosite, the fold change is taken as the log2 value, and the P-value is taken as the absolute value of the log10 value to create a volcano plot.

Image
Image
1/1
The HCA heatmap of the differential phosphosites

The HCA heatmap of the differential phosphosites. A Hierarchical Cluster Analysis (HCA) heatmap is used to illustrate the up-regulation and down-regulation of different phosphosites when comparing different samples.

Image
Image
1/1
The bar chart of the number of upregulated and downregulated modification site-corresponding proteins

Based on the GO enrichment results in this project, the bar charts were plotted to compare the numbers of upregulated and downregulated proteins corresponding to the differential modification sites enriched in GO.

Image
Image
1/1
The annotation of differential phosphosite-associated proteins in enriched KEGG pathway

In the map, the differential phosphosite-associated proteins are highlighted.

Image
Image
1/1
The bubble plot of domain enrichment

Protein domain enrichment analysis can identify statistically significantly enriched domain entries. These functions or locations may be the reasons for the differences.

More Services

Quantitative Proteomics
(Quantitative Proteomics)
Quantitative Proteomics
(Quantitative Proteomics)
Olink Proteomics
(Olink Proteomics)
Olink Proteomics
(Olink Proteomics)
Untargeted Metabolomics
(Untargeted Metabolomics)
Untargeted Metabolomics
(Untargeted Metabolomics)

More Services

Quantitative Proteomics
(Quantitative Proteomics)
Quantitative Proteomics
(Quantitative Proteomics)
Olink Proteomics
(Olink Proteomics)
Olink Proteomics
(Olink Proteomics)
Untargeted Metabolomics
(Untargeted Metabolomics)
Untargeted Metabolomics
(Untargeted Metabolomics)
Background
Background

Ready to Start Your Project?

Our platform offers tailored solutions for

your unique experimental needs, ensuring a seamless experience from project design to data delivery.


Your Privacy ChoicesPrivacy PolicyCookie PolicyCareers
banner laptop bg
banner mobile bg

PTM Proteomics

PTM proteomics systematically characterizes the types, sites, and dynamics of protein post-translational modifications across the proteome. Deep phosphoproteomics provides large-scale quantiatitative analysis of protein phosphorylation sites and is a useful tool to define signaling network regulation and dysregulation.
OverviewOverview
BenefitsBenefits
ApplicationsApplications
SpecificationsSpecifications
ResourcesResources

Protein phosphorylation is one of the most common and important PTMs. This reversible mechanism occurs through protein kinases and consists of the addition of a phosphate group (PO4) to the polar group R of various amino acids (eg. serine/S, threonine/T, or tyrosine/Y). Phosphorylation is the primary mechanism driving cellular signal transduction. It governs everything from cell cycle progression, apoptosis, and growth to complex metabolic regulation and immune responses. Mapping these systems is a cornerstone of biomedical research.


Novogene provides deep phosphoproteomics services with the Obitrap Astral platform with a throughput of 60 samples per day (60 SPD).The workflow encompasses protein extraction, digestion, enrichment, desalting, instrumental analysis, and data processing with a turnaround time of 4 weeks.

Why Choose Novogene for Your PTM Proteomics Needs?

Deep & High-Accuracy PTM Site IdentificationDeep & High-Accuracy PTM Site Identification
Deep & High-Accuracy PTM Site Identification

In-depth analysis of PTMs that decodes "dark matter" of life regulation with increased depth of site identification and Improved accuracy of site identification (Class I sites ≥ 90%).

Deep & High-Accuracy PTM Site Identification

In-depth analysis of PTMs that decodes "dark matter" of life regulation with increased depth of site identification and Improved accuracy of site identification (Class I sites ≥ 90%).

Precise Modification Localization & Dynamic QuantificationPrecise Modification Localization & Dynamic Quantification
Precise Modification Localization & Dynamic Quantification

Multi-dimensional analysis and annotation that precisely localizes modification sites and quantifies dynamic fluctuations.

Precise Modification Localization & Dynamic Quantification

Multi-dimensional analysis and annotation that precisely localizes modification sites and quantifies dynamic fluctuations.

Multi-Dimensional Functional Decoding of PTMsMulti-Dimensional Functional Decoding of PTMs
Multi-Dimensional Functional Decoding of PTMs

Multi-dimensional functional decoding through the analysis of domains, kinase prediction, interaction networks, disease associations, etc. to transform high-dimensional data into functional catalogues.

Multi-Dimensional Functional Decoding of PTMs

Multi-dimensional functional decoding through the analysis of domains, kinase prediction, interaction networks, disease associations, etc. to transform high-dimensional data into functional catalogues.

Why Choose Novogene for Your PTM Proteomics Needs?

Deep & High-Accuracy PTM Site IdentificationDeep & High-Accuracy PTM Site Identification
Deep & High-Accuracy PTM Site Identification

In-depth analysis of PTMs that decodes "dark matter" of life regulation with increased depth of site identification and Improved accuracy of site identification (Class I sites ≥ 90%).

Deep & High-Accuracy PTM Site Identification

In-depth analysis of PTMs that decodes "dark matter" of life regulation with increased depth of site identification and Improved accuracy of site identification (Class I sites ≥ 90%).

Precise Modification Localization & Dynamic QuantificationPrecise Modification Localization & Dynamic Quantification
Precise Modification Localization & Dynamic Quantification

Multi-dimensional analysis and annotation that precisely localizes modification sites and quantifies dynamic fluctuations.

Precise Modification Localization & Dynamic Quantification

Multi-dimensional analysis and annotation that precisely localizes modification sites and quantifies dynamic fluctuations.

Multi-Dimensional Functional Decoding of PTMsMulti-Dimensional Functional Decoding of PTMs
Multi-Dimensional Functional Decoding of PTMs

Multi-dimensional functional decoding through the analysis of domains, kinase prediction, interaction networks, disease associations, etc. to transform high-dimensional data into functional catalogues.

Multi-Dimensional Functional Decoding of PTMs

Multi-dimensional functional decoding through the analysis of domains, kinase prediction, interaction networks, disease associations, etc. to transform high-dimensional data into functional catalogues.

Applications

Novogene delivers high-quality data and publication-ready analysis results of deep phosphoproteomics to faciliate research including:

Regulation of protein function

PTMs precisely control protein activity, stability, localization, and interactions. This allows cells to dynamically fine-tune protein behavior in response to stimuli, regulating essential processes from signal transduction and metabolism to gene expression.

Regulation of protein function

PTMs precisely control protein activity, stability, localization, and interactions. This allows cells to dynamically fine-tune protein behavior in response to stimuli, regulating essential processes from signal transduction and metabolism to gene expression.

Enzyme regulation

PTMs directly regulate enzyme activity. For instance, phosphorylation can activate or inhibit catalytic function, thereby controlling key cellular signaling and metabolic pathways.

Enzyme regulation

PTMs directly regulate enzyme activity. For instance, phosphorylation can activate or inhibit catalytic function, thereby controlling key cellular signaling and metabolic pathways.

Cell signaling

PTMs are central to cellular communication. Modifications (like phosphorylation) act as molecular switches that turn proteins "on" or "off," enabling cells to relay and respond to signals effectively.

Cell signaling

PTMs are central to cellular communication. Modifications (like phosphorylation) act as molecular switches that turn proteins "on" or "off," enabling cells to relay and respond to signals effectively.

Disease biomarkers

Aberrant PTM patterns are directly linked to diseases such as cancer and neurodegenerative disorders. Detecting these altered PTMs provides valuable biomarkers for improved diagnosis, prognosis, and drug target identification.

Disease biomarkers

Aberrant PTM patterns are directly linked to diseases such as cancer and neurodegenerative disorders. Detecting these altered PTMs provides valuable biomarkers for improved diagnosis, prognosis, and drug target identification.

Drug development

Understanding PTMs enables the design of targeted therapies. Modifying specific PTMs can restore normal protein function and cellular processes, presenting promising new therapeutic strategies.

Drug development

Understanding PTMs enables the design of targeted therapies. Modifying specific PTMs can restore normal protein function and cellular processes, presenting promising new therapeutic strategies.

Applications

Novogene delivers high-quality data and publication-ready analysis results of deep phosphoproteomics to faciliate research including:

Regulation of protein function

PTMs precisely control protein activity, stability, localization, and interactions. This allows cells to dynamically fine-tune protein behavior in response to stimuli, regulating essential processes from signal transduction and metabolism to gene expression.

Regulation of protein function

PTMs precisely control protein activity, stability, localization, and interactions. This allows cells to dynamically fine-tune protein behavior in response to stimuli, regulating essential processes from signal transduction and metabolism to gene expression.

Enzyme regulation

PTMs directly regulate enzyme activity. For instance, phosphorylation can activate or inhibit catalytic function, thereby controlling key cellular signaling and metabolic pathways.

Enzyme regulation

PTMs directly regulate enzyme activity. For instance, phosphorylation can activate or inhibit catalytic function, thereby controlling key cellular signaling and metabolic pathways.

Cell signaling

PTMs are central to cellular communication. Modifications (like phosphorylation) act as molecular switches that turn proteins "on" or "off," enabling cells to relay and respond to signals effectively.

Cell signaling

PTMs are central to cellular communication. Modifications (like phosphorylation) act as molecular switches that turn proteins "on" or "off," enabling cells to relay and respond to signals effectively.

Disease biomarkers

Aberrant PTM patterns are directly linked to diseases such as cancer and neurodegenerative disorders. Detecting these altered PTMs provides valuable biomarkers for improved diagnosis, prognosis, and drug target identification.

Disease biomarkers

Aberrant PTM patterns are directly linked to diseases such as cancer and neurodegenerative disorders. Detecting these altered PTMs provides valuable biomarkers for improved diagnosis, prognosis, and drug target identification.

Drug development

Understanding PTMs enables the design of targeted therapies. Modifying specific PTMs can restore normal protein function and cellular processes, presenting promising new therapeutic strategies.

Drug development

Understanding PTMs enables the design of targeted therapies. Modifying specific PTMs can restore normal protein function and cellular processes, presenting promising new therapeutic strategies.

Specifications

Sample Requirements

Sample amounts are listed for reference only. Download the Sample Submission Guidelines to learn more. For detailed information, please contact us with your customized requests.

Sample TypeAmount
Animal tissuesGeneral tissue (brain, heart, liver, spleen, lung, kidney, muscle, etc.)100 mg
Plant tissuesSoft tissues (leaves, flowers, algae, ferns, etc.)500 mg
Fruit pulp1 g
Seeds5 g
Pollen4 g
CellsSuspension/Adherent cultured cells400 μL
MicroorganismsCommon bacteria2×107 (50 μL cell pellet)
Fungal mycelium200 mg or 200 μL pellet

Sample Requirements

Sample amounts are listed for reference only. Download the Sample Submission Guidelines to learn more. For detailed information, please contact us with your customized requests.

Sample TypeAmount
Animal tissuesGeneral tissue (brain, heart, liver, spleen, lung, kidney, muscle, etc.)100 mg
Plant tissuesSoft tissues (leaves, flowers, algae, ferns, etc.)500 mg
Fruit pulp1 g
Seeds5 g
Pollen4 g
CellsSuspension/Adherent cultured cells400 μL
MicroorganismsCommon bacteria2×107 (50 μL cell pellet)
Fungal mycelium200 mg or 200 μL pellet

Sample Requirements

Sample amounts are listed for reference only. Download the Sample Submission Guidelines to learn more. For detailed information, please contact us with your customized requests.

Sample TypeAmount
Animal tissuesGeneral tissue (brain, heart, liver, spleen, lung, kidney, muscle, etc.)100 mg
Plant tissuesSoft tissues (leaves, flowers, algae, ferns, etc.)500 mg
Fruit pulp1 g
Seeds5 g
Pollen4 g
CellsSuspension/Adherent cultured cells400 μL
MicroorganismsCommon bacteria2×107 (50 μL cell pellet)
Fungal mycelium200 mg or 200 μL pellet

Sample Requirements

Sample amounts are listed for reference only. Download the Sample Submission Guidelines to learn more. For detailed information, please contact us with your customized requests.

Sample TypeAmount
Animal tissuesGeneral tissue (brain, heart, liver, spleen, lung, kidney, muscle, etc.)100 mg
Plant tissuesSoft tissues (leaves, flowers, algae, ferns, etc.)500 mg
Fruit pulp1 g
Seeds5 g
Pollen4 g
CellsSuspension/Adherent cultured cells400 μL
MicroorganismsCommon bacteria2×107 (50 μL cell pellet)
Fungal mycelium200 mg or 200 μL pellet

Overview of Data Processing and Bioinformatic Analysis

Recommended data outputs and analysis contents displayed are for reference only. For detailed information, please contact us with your customized requests.

Overview of Data Processing and Bioinformatic Analysis

Overview of Data Processing and Bioinformatic Analysis

Recommended data outputs and analysis contents displayed are for reference only. For detailed information, please contact us with your customized requests.

Overview of Data Processing and Bioinformatic Analysis

Overview of Data Processing and Bioinformatic Analysis

Recommended data outputs and analysis contents displayed are for reference only. For detailed information, please contact us with your customized requests.

Overview of Data Processing and Bioinformatic Analysis

Overview of Data Processing and Bioinformatic Analysis

Recommended data outputs and analysis contents displayed are for reference only. For detailed information, please contact us with your customized requests.

Overview of Data Processing and Bioinformatic Analysis

Project Workflow

Novogene provides high-quality products and expert services throughout the entire project workflow. From sample preparation to data acquisition, every step in the process-including protein extraction, quantification, detection, enzymatic digestion, modified peptide enrichment and desalting, and mass spectrometry analysis can influence the quality of the data. To ensure accurate and reliable results, Novogene maintains tight control over each step, fundamentally safeguarding data quality. The experimental workflow is provided below.

Project Workflow

Project Workflow

Novogene provides high-quality products and expert services throughout the entire project workflow. From sample preparation to data acquisition, every step in the process-including protein extraction, quantification, detection, enzymatic digestion, modified peptide enrichment and desalting, and mass spectrometry analysis can influence the quality of the data. To ensure accurate and reliable results, Novogene maintains tight control over each step, fundamentally safeguarding data quality. The experimental workflow is provided below.

Project Workflow

Project Workflow

Novogene provides high-quality products and expert services throughout the entire project workflow. From sample preparation to data acquisition, every step in the process-including protein extraction, quantification, detection, enzymatic digestion, modified peptide enrichment and desalting, and mass spectrometry analysis can influence the quality of the data. To ensure accurate and reliable results, Novogene maintains tight control over each step, fundamentally safeguarding data quality. The experimental workflow is provided below.

Project Workflow

Project Workflow

Novogene provides high-quality products and expert services throughout the entire project workflow. From sample preparation to data acquisition, every step in the process-including protein extraction, quantification, detection, enzymatic digestion, modified peptide enrichment and desalting, and mass spectrometry analysis can influence the quality of the data. To ensure accurate and reliable results, Novogene maintains tight control over each step, fundamentally safeguarding data quality. The experimental workflow is provided below.

Project Workflow

Specifications

Sample Requirements

Sample amounts are listed for reference only. Download the Sample Submission Guidelines to learn more. For detailed information, please contact us with your customized requests.

Sample TypeAmount
Animal tissuesGeneral tissue (brain, heart, liver, spleen, lung, kidney, muscle, etc.)100 mg
Plant tissuesSoft tissues (leaves, flowers, algae, ferns, etc.)500 mg
Fruit pulp1 g
Seeds5 g
Pollen4 g
CellsSuspension/Adherent cultured cells400 μL
MicroorganismsCommon bacteria2×107 (50 μL cell pellet)
Fungal mycelium200 mg or 200 μL pellet

Sample Requirements

Sample amounts are listed for reference only. Download the Sample Submission Guidelines to learn more. For detailed information, please contact us with your customized requests.

Sample TypeAmount
Animal tissuesGeneral tissue (brain, heart, liver, spleen, lung, kidney, muscle, etc.)100 mg
Plant tissuesSoft tissues (leaves, flowers, algae, ferns, etc.)500 mg
Fruit pulp1 g
Seeds5 g
Pollen4 g
CellsSuspension/Adherent cultured cells400 μL
MicroorganismsCommon bacteria2×107 (50 μL cell pellet)
Fungal mycelium200 mg or 200 μL pellet

Sample Requirements

Sample amounts are listed for reference only. Download the Sample Submission Guidelines to learn more. For detailed information, please contact us with your customized requests.

Sample TypeAmount
Animal tissuesGeneral tissue (brain, heart, liver, spleen, lung, kidney, muscle, etc.)100 mg
Plant tissuesSoft tissues (leaves, flowers, algae, ferns, etc.)500 mg
Fruit pulp1 g
Seeds5 g
Pollen4 g
CellsSuspension/Adherent cultured cells400 μL
MicroorganismsCommon bacteria2×107 (50 μL cell pellet)
Fungal mycelium200 mg or 200 μL pellet

Sample Requirements

Sample amounts are listed for reference only. Download the Sample Submission Guidelines to learn more. For detailed information, please contact us with your customized requests.

Sample TypeAmount
Animal tissuesGeneral tissue (brain, heart, liver, spleen, lung, kidney, muscle, etc.)100 mg
Plant tissuesSoft tissues (leaves, flowers, algae, ferns, etc.)500 mg
Fruit pulp1 g
Seeds5 g
Pollen4 g
CellsSuspension/Adherent cultured cells400 μL
MicroorganismsCommon bacteria2×107 (50 μL cell pellet)
Fungal mycelium200 mg or 200 μL pellet

Overview of Data Processing and Bioinformatic Analysis

Recommended data outputs and analysis contents displayed are for reference only. For detailed information, please contact us with your customized requests.

Overview of Data Processing and Bioinformatic Analysis

Overview of Data Processing and Bioinformatic Analysis

Recommended data outputs and analysis contents displayed are for reference only. For detailed information, please contact us with your customized requests.

Overview of Data Processing and Bioinformatic Analysis

Overview of Data Processing and Bioinformatic Analysis

Recommended data outputs and analysis contents displayed are for reference only. For detailed information, please contact us with your customized requests.

Overview of Data Processing and Bioinformatic Analysis

Overview of Data Processing and Bioinformatic Analysis

Recommended data outputs and analysis contents displayed are for reference only. For detailed information, please contact us with your customized requests.

Overview of Data Processing and Bioinformatic Analysis

Project Workflow

Novogene provides high-quality products and expert services throughout the entire project workflow. From sample preparation to data acquisition, every step in the process-including protein extraction, quantification, detection, enzymatic digestion, modified peptide enrichment and desalting, and mass spectrometry analysis can influence the quality of the data. To ensure accurate and reliable results, Novogene maintains tight control over each step, fundamentally safeguarding data quality. The experimental workflow is provided below.

Project Workflow

Project Workflow

Novogene provides high-quality products and expert services throughout the entire project workflow. From sample preparation to data acquisition, every step in the process-including protein extraction, quantification, detection, enzymatic digestion, modified peptide enrichment and desalting, and mass spectrometry analysis can influence the quality of the data. To ensure accurate and reliable results, Novogene maintains tight control over each step, fundamentally safeguarding data quality. The experimental workflow is provided below.

Project Workflow

Project Workflow

Novogene provides high-quality products and expert services throughout the entire project workflow. From sample preparation to data acquisition, every step in the process-including protein extraction, quantification, detection, enzymatic digestion, modified peptide enrichment and desalting, and mass spectrometry analysis can influence the quality of the data. To ensure accurate and reliable results, Novogene maintains tight control over each step, fundamentally safeguarding data quality. The experimental workflow is provided below.

Project Workflow

Project Workflow

Novogene provides high-quality products and expert services throughout the entire project workflow. From sample preparation to data acquisition, every step in the process-including protein extraction, quantification, detection, enzymatic digestion, modified peptide enrichment and desalting, and mass spectrometry analysis can influence the quality of the data. To ensure accurate and reliable results, Novogene maintains tight control over each step, fundamentally safeguarding data quality. The experimental workflow is provided below.

Project Workflow

Resources

Image
Image
1/1
Phosphorylated kinase site expression level chart

For the identified phosphosites, the kinases involved in phosphorylation process were predicted. Top 100 kinases with the highest prediction scores were selected for quantitative analysis.

Image
Image
1/1
The volcano plot of the differential phosphosites

For each differential phosphosite, the fold change is taken as the log2 value, and the P-value is taken as the absolute value of the log10 value to create a volcano plot.

Image
Image
1/1
The HCA heatmap of the differential phosphosites

The HCA heatmap of the differential phosphosites. A Hierarchical Cluster Analysis (HCA) heatmap is used to illustrate the up-regulation and down-regulation of different phosphosites when comparing different samples.

Image
Image
1/1
The bar chart of the number of upregulated and downregulated modification site-corresponding proteins

Based on the GO enrichment results in this project, the bar charts were plotted to compare the numbers of upregulated and downregulated proteins corresponding to the differential modification sites enriched in GO.

Image
Image
1/1
The annotation of differential phosphosite-associated proteins in enriched KEGG pathway

In the map, the differential phosphosite-associated proteins are highlighted.

Image
Image
1/1
The bubble plot of domain enrichment

Protein domain enrichment analysis can identify statistically significantly enriched domain entries. These functions or locations may be the reasons for the differences.

Image
Image
1/1
Phosphorylated kinase site expression level chart

For the identified phosphosites, the kinases involved in phosphorylation process were predicted. Top 100 kinases with the highest prediction scores were selected for quantitative analysis.

Image
Image
1/1
The volcano plot of the differential phosphosites

For each differential phosphosite, the fold change is taken as the log2 value, and the P-value is taken as the absolute value of the log10 value to create a volcano plot.

Image
Image
1/1
The HCA heatmap of the differential phosphosites

The HCA heatmap of the differential phosphosites. A Hierarchical Cluster Analysis (HCA) heatmap is used to illustrate the up-regulation and down-regulation of different phosphosites when comparing different samples.

Image
Image
1/1
The bar chart of the number of upregulated and downregulated modification site-corresponding proteins

Based on the GO enrichment results in this project, the bar charts were plotted to compare the numbers of upregulated and downregulated proteins corresponding to the differential modification sites enriched in GO.

Image
Image
1/1
The annotation of differential phosphosite-associated proteins in enriched KEGG pathway

In the map, the differential phosphosite-associated proteins are highlighted.

Image
Image
1/1
The bubble plot of domain enrichment

Protein domain enrichment analysis can identify statistically significantly enriched domain entries. These functions or locations may be the reasons for the differences.

Resources

Image
Image
1/1
Phosphorylated kinase site expression level chart

For the identified phosphosites, the kinases involved in phosphorylation process were predicted. Top 100 kinases with the highest prediction scores were selected for quantitative analysis.

Image
Image
1/1
The volcano plot of the differential phosphosites

For each differential phosphosite, the fold change is taken as the log2 value, and the P-value is taken as the absolute value of the log10 value to create a volcano plot.

Image
Image
1/1
The HCA heatmap of the differential phosphosites

The HCA heatmap of the differential phosphosites. A Hierarchical Cluster Analysis (HCA) heatmap is used to illustrate the up-regulation and down-regulation of different phosphosites when comparing different samples.

Image
Image
1/1
The bar chart of the number of upregulated and downregulated modification site-corresponding proteins

Based on the GO enrichment results in this project, the bar charts were plotted to compare the numbers of upregulated and downregulated proteins corresponding to the differential modification sites enriched in GO.

Image
Image
1/1
The annotation of differential phosphosite-associated proteins in enriched KEGG pathway

In the map, the differential phosphosite-associated proteins are highlighted.

Image
Image
1/1
The bubble plot of domain enrichment

Protein domain enrichment analysis can identify statistically significantly enriched domain entries. These functions or locations may be the reasons for the differences.

Image
Image
1/1
Phosphorylated kinase site expression level chart

For the identified phosphosites, the kinases involved in phosphorylation process were predicted. Top 100 kinases with the highest prediction scores were selected for quantitative analysis.

Image
Image
1/1
The volcano plot of the differential phosphosites

For each differential phosphosite, the fold change is taken as the log2 value, and the P-value is taken as the absolute value of the log10 value to create a volcano plot.

Image
Image
1/1
The HCA heatmap of the differential phosphosites

The HCA heatmap of the differential phosphosites. A Hierarchical Cluster Analysis (HCA) heatmap is used to illustrate the up-regulation and down-regulation of different phosphosites when comparing different samples.

Image
Image
1/1
The bar chart of the number of upregulated and downregulated modification site-corresponding proteins

Based on the GO enrichment results in this project, the bar charts were plotted to compare the numbers of upregulated and downregulated proteins corresponding to the differential modification sites enriched in GO.

Image
Image
1/1
The annotation of differential phosphosite-associated proteins in enriched KEGG pathway

In the map, the differential phosphosite-associated proteins are highlighted.

Image
Image
1/1
The bubble plot of domain enrichment

Protein domain enrichment analysis can identify statistically significantly enriched domain entries. These functions or locations may be the reasons for the differences.

More Services

Quantitative Proteomics
(Quantitative Proteomics)
Quantitative Proteomics
(Quantitative Proteomics)
Olink Proteomics
(Olink Proteomics)
Olink Proteomics
(Olink Proteomics)
Untargeted Metabolomics
(Untargeted Metabolomics)
Untargeted Metabolomics
(Untargeted Metabolomics)

More Services

Quantitative Proteomics
(Quantitative Proteomics)
Quantitative Proteomics
(Quantitative Proteomics)
Olink Proteomics
(Olink Proteomics)
Olink Proteomics
(Olink Proteomics)
Untargeted Metabolomics
(Untargeted Metabolomics)
Untargeted Metabolomics
(Untargeted Metabolomics)
Background
Background

Ready to Start Your Project?

Our platform offers tailored solutions for

your unique experimental needs, ensuring a seamless experience from project design to data delivery.


Your Privacy ChoicesPrivacy PolicyCookie PolicyCareers