
• Cart
    • Quote
    • Inquiry
    • Cart
    • Quote
    • Inquiry
Novogene
  • Novogene
  • Genomics
    • Human Whole Genome Sequencing
    • Whole Exome Sequencing
    • Plant and Animal Whole Genome Sequencing
    • Plant and Animal De Novo Sequencing
    • Microbial Whole Genome Sequencing
    • Microbial De Novo Sequencing

    Metagenomics

    • Shotgun Metagenomics Sequencing
    • Amplicon Sequencing

    Transcriptomics

    • mRNA Sequencing
    • Swift & Express mRNA Sequencing New!
    • Full-Length Transcriptome Sequencing
    • Prokaryotic RNA Sequencing
    • Metatranscriptome Sequencing
    • Total RNA Sequencing
    • Small RNA Sequencing (sRNA‑seq)
    • Whole Transcriptome Sequencing

    Single Cell & Spatial Omics

    • 10x Single Cell Gene Expression
    • Illumina PIP-seq Single Cell 3’ RNA Sequencing New!
    • Spatial Transcriptomics Sequencing New!

    Epigenomics

    • Whole Genome Bisulfite Sequencing (WGBS)
    • Enzymatic Methylation Sequencing
    • Directed Methylation Sequencing (DM-Seq) New!
    • RNA Immunoprecipitation Sequencing (RIP-seq)
    • Chromatin Immunoprecipitation Sequencing (ChIP-seq)
    • Cleavage Under Targets & Tagmentation (CUT&Tag) New!
    • Assay for Transposase-Accessible Chromatin with Sequencing (ATAC-seq)
    • Reduced Representation Bisulfite Sequencing (RRBS)

    Proteomics

    • Quantitative Proteomics New!
    • PTM Proteomics New!
    • Olink Proteomics New!

    Metabolomics

    • Untargeted Metabolomics

    Premade Library

    • Sequencing Only on Illumina Sequencer
    • Sequencing Only on Ultima Sequencer
  • PromotionsPromotions
    • Platforms
    • Service & Support
    • Automated Delivery Platform (Falcon)
    • Bioinformatics Analysis Tool (NovoMagic)
    • Customer Service System (CSS)
    • Case Study
    • Blog
    • Webinar
    • Brochure
    • Cancer Research
    • Immuno-oncology
    • Agrigenomics
    • Environment
    • Food Science
    • Human Microbiome
    • Plant and Animal Microbiome
    • Drug Discovery and Development
    • Rare and Complex Diseases
    • About Us
    • Our Locations
    • News & Events
    • Careers
  • Contact UsContact Us
    • mRNA Sequencing
    • Illumina Lane Sequencing

ServicesServices menu

CompanyCompany menu

Contact UsContact Us menu

Service SupportService Support menu

Services
mRNA SequencingSwift & Express mRNA SequencingTotal RNA SequencingHuman Whole Genome SequencingWhole Exome Sequencing10x Single Cell Gene ExpressionIllumina PIP-seq Single Cell 3’ RNA SequencingSpatial Transcriptomics SequencingWhole Genome Bisulfite Sequencing (WGBS)Quantitative ProteomicsUntargeted MetabolomicsShotgun Metagenomics SequencingMetatranscriptome SequencingSequencing Only on Illumina SequencerSequencing Only on Ultima SequencerFull-Length Transcriptome SequencingChromatin Immunoprecipitation Sequencing (ChIP-seq)
Company
About UsOur LocationsNews & EventsCareers
Contact Us
Contact Us
Service Support
Automated Delivery Platform (Falcon)Bioinformatics Analysis Tool (NovoMagic)Customer Service System (CSS)
LinkedInLinkedIn hoverYouTubeYouTube hoverXX hoverMetaMeta hoverInstagramInstagram hover
Copyright © 2026 Novogene Corporation Inc. All rights reserved. For Research Use Only.
    • Cart
    • Quote
    • Inquiry
    • Cart
    • Quote
    • Inquiry
Novogene
  • Novogene
  • Genomics
    • Human Whole Genome Sequencing
    • Whole Exome Sequencing
    • Plant and Animal Whole Genome Sequencing
    • Plant and Animal De Novo Sequencing
    • Microbial Whole Genome Sequencing
    • Microbial De Novo Sequencing

    Metagenomics

    • Shotgun Metagenomics Sequencing
    • Amplicon Sequencing

    Transcriptomics

    • mRNA Sequencing
    • Swift & Express mRNA Sequencing New!
    • Full-Length Transcriptome Sequencing
    • Prokaryotic RNA Sequencing
    • Metatranscriptome Sequencing
    • Total RNA Sequencing
    • Small RNA Sequencing (sRNA‑seq)
    • Whole Transcriptome Sequencing

    Single Cell & Spatial Omics

    • 10x Single Cell Gene Expression
    • Illumina PIP-seq Single Cell 3’ RNA Sequencing New!
    • Spatial Transcriptomics Sequencing New!

    Epigenomics

    • Whole Genome Bisulfite Sequencing (WGBS)
    • Enzymatic Methylation Sequencing
    • Directed Methylation Sequencing (DM-Seq) New!
    • RNA Immunoprecipitation Sequencing (RIP-seq)
    • Chromatin Immunoprecipitation Sequencing (ChIP-seq)
    • Cleavage Under Targets & Tagmentation (CUT&Tag) New!
    • Assay for Transposase-Accessible Chromatin with Sequencing (ATAC-seq)
    • Reduced Representation Bisulfite Sequencing (RRBS)

    Proteomics

    • Quantitative Proteomics New!
    • PTM Proteomics New!
    • Olink Proteomics New!

    Metabolomics

    • Untargeted Metabolomics

    Premade Library

    • Sequencing Only on Illumina Sequencer
    • Sequencing Only on Ultima Sequencer
  • PromotionsPromotions
    • Platforms
    • Service & Support
    • Automated Delivery Platform (Falcon)
    • Bioinformatics Analysis Tool (NovoMagic)
    • Customer Service System (CSS)
    • Case Study
    • Blog
    • Webinar
    • Brochure
    • Cancer Research
    • Immuno-oncology
    • Agrigenomics
    • Environment
    • Food Science
    • Human Microbiome
    • Plant and Animal Microbiome
    • Drug Discovery and Development
    • Rare and Complex Diseases
    • About Us
    • Our Locations
    • News & Events
    • Careers
  • Contact UsContact Us
    • mRNA Sequencing
    • Illumina Lane Sequencing

ServicesServices menu

CompanyCompany menu

Contact UsContact Us menu

Service SupportService Support menu

Services
mRNA SequencingSwift & Express mRNA SequencingTotal RNA SequencingHuman Whole Genome SequencingWhole Exome Sequencing10x Single Cell Gene ExpressionIllumina PIP-seq Single Cell 3’ RNA SequencingSpatial Transcriptomics SequencingWhole Genome Bisulfite Sequencing (WGBS)Quantitative ProteomicsUntargeted MetabolomicsShotgun Metagenomics SequencingMetatranscriptome SequencingSequencing Only on Illumina SequencerSequencing Only on Ultima SequencerFull-Length Transcriptome SequencingChromatin Immunoprecipitation Sequencing (ChIP-seq)
Company
About UsOur LocationsNews & EventsCareers
Contact Us
Contact Us
Service Support
Automated Delivery Platform (Falcon)Bioinformatics Analysis Tool (NovoMagic)Customer Service System (CSS)
LinkedInLinkedIn hoverYouTubeYouTube hoverXX hoverMetaMeta hoverInstagramInstagram hover
Copyright © 2026 Novogene Corporation Inc. All rights reserved. For Research Use Only.
banner laptop bg
banner mobile bg

Olink Proteomics

High-throughput, targeted protein profiling to quantify low-abundance biomarkers and reveal biological pathways associated with health and disease.
OverviewOverview
BenefitsBenefits
ApplicationsApplications
SpecificationsSpecifications
ResourcesResources

Olink Proteomics is a high-throughput proteomics solution for protein biomarker discovery in human body fluids--such as plasma, serum, cerebrospinal fluid, and urine--with exceptional efficiency. Olink Proteomics employ Proximity Extension Assay (PEA) technology to target thansands of proteins, which are subsequently quantified via Next-Genration Sequencing (NGS). By integrating the specificity of immunoassays with the scalability and precision of sequencing, Olink Proteomics delivers outstanding specificity, sensitivity, and scalability. This makes it an ideal tool for researchers investigating complex biological systems, disease mechanisms, and potential therapeutic targets through protein biomarker analysis.


We are among the first certified providers worldwide to offer high-throughput, high-quality protein biomarker discovery services using Olink’s leading proteomics platforms with Olink Reveal Panel


Why Choose Olink Proteomics

High Specificity

Dual-antibody PEA technology ensures precise target recognition by requiring simultaneous binding for detection.

High Specificity

Dual-antibody PEA technology ensures precise target recognition by requiring simultaneous binding for detection.

High Sensitivity and Wide Dynamic Range

10-log dynamic range (fg/mL to mg/mL) with full coverage of high, medium and low abundance proteins

High Sensitivity and Wide Dynamic Range

10-log dynamic range (fg/mL to mg/mL) with full coverage of high, medium and low abundance proteins

High Throughput

Screen up to 1000+ proteins per sample

High Throughput

Screen up to 1000+ proteins per sample

Low Sample Volume

as low as 2~4 uL for each sample matrix, ideal for precious biobank samples

Low Sample Volume

as low as 2~4 uL for each sample matrix, ideal for precious biobank samples

Why Choose Olink Proteomics

High Specificity

Dual-antibody PEA technology ensures precise target recognition by requiring simultaneous binding for detection.

High Specificity

Dual-antibody PEA technology ensures precise target recognition by requiring simultaneous binding for detection.

High Sensitivity and Wide Dynamic Range

10-log dynamic range (fg/mL to mg/mL) with full coverage of high, medium and low abundance proteins

High Sensitivity and Wide Dynamic Range

10-log dynamic range (fg/mL to mg/mL) with full coverage of high, medium and low abundance proteins

High Throughput

Screen up to 1000+ proteins per sample

High Throughput

Screen up to 1000+ proteins per sample

Low Sample Volume

as low as 2~4 uL for each sample matrix, ideal for precious biobank samples

Low Sample Volume

as low as 2~4 uL for each sample matrix, ideal for precious biobank samples

Why Choose Novogene for your Olink Proteomics?

Olink Certified Service ProviderOlink Certified Service Provider
Olink Certified Service Provider

Global CSP for Olink Reveal Proteomics

Olink Certified Service Provider

Global CSP for Olink Reveal Proteomics

Comprehensive AnalysisComprehensive Analysis
Comprehensive Analysis

Bioinformatic expertise supporting multiomics analysis and customized analysis

Comprehensive Analysis

Bioinformatic expertise supporting multiomics analysis and customized analysis

Outstanding Project Management Outstanding Project Management 
Outstanding Project Management 

Dedicated team supporting projects of any scale

Outstanding Project Management 

Dedicated team supporting projects of any scale

Why Choose Novogene for your Olink Proteomics?

Olink Certified Service ProviderOlink Certified Service Provider
Olink Certified Service Provider

Global CSP for Olink Reveal Proteomics

Olink Certified Service Provider

Global CSP for Olink Reveal Proteomics

Comprehensive AnalysisComprehensive Analysis
Comprehensive Analysis

Bioinformatic expertise supporting multiomics analysis and customized analysis

Comprehensive Analysis

Bioinformatic expertise supporting multiomics analysis and customized analysis

Outstanding Project Management Outstanding Project Management 
Outstanding Project Management 

Dedicated team supporting projects of any scale

Outstanding Project Management 

Dedicated team supporting projects of any scale

Applications of Olink Proteomics in Research and Medicine

Discover the power of Olink Proteomics with Novogene’s services, designed to assist in a variety of research goals:

Proteomic profiling

Screen disease-specific biomarkers; identify protein signatures for precision medicine or treatment response

Proteomic profiling

Screen disease-specific biomarkers; identify protein signatures for precision medicine or treatment response

Disease classification

Develop diagnostic and prognostic model by integrating proteomics with genomic and clinical data

Disease classification

Develop diagnostic and prognostic model by integrating proteomics with genomic and clinical data

Drug development

Identify drug targets and therapeutic biomarkers, gain insights into drug efficacy and mechanism-of-action

Drug development

Identify drug targets and therapeutic biomarkers, gain insights into drug efficacy and mechanism-of-action

Applications of Olink Proteomics in Research and Medicine

Discover the power of Olink Proteomics with Novogene’s services, designed to assist in a variety of research goals:

Proteomic profiling

Screen disease-specific biomarkers; identify protein signatures for precision medicine or treatment response

Proteomic profiling

Screen disease-specific biomarkers; identify protein signatures for precision medicine or treatment response

Disease classification

Develop diagnostic and prognostic model by integrating proteomics with genomic and clinical data

Disease classification

Develop diagnostic and prognostic model by integrating proteomics with genomic and clinical data

Drug development

Identify drug targets and therapeutic biomarkers, gain insights into drug efficacy and mechanism-of-action

Drug development

Identify drug targets and therapeutic biomarkers, gain insights into drug efficacy and mechanism-of-action

Specifications

Sample Requirements

Sample amounts are listed for reference only. Download the Sample Submission Guidelines to learn more. For detailed information, please contact us with your customized requests.

Sample typeVolumeNotes
Human Plasma/Serum≥50 μL• Please include enough dry ice and send by frozen delivery to avoid sample thawing during shipping.
• It is recommended to store samples at −80 °C immediately after extraction as hemolysis may affect the analysis results 
Other sample matricesExamples – CSF, lysates, cell culture supernatant, etc.
Please contact us for more information. 

Sample Requirements

Sample amounts are listed for reference only. Download the Sample Submission Guidelines to learn more. For detailed information, please contact us with your customized requests.

Sample typeVolumeNotes
Human Plasma/Serum≥50 μL• Please include enough dry ice and send by frozen delivery to avoid sample thawing during shipping.
• It is recommended to store samples at −80 °C immediately after extraction as hemolysis may affect the analysis results 
Other sample matricesExamples – CSF, lysates, cell culture supernatant, etc.
Please contact us for more information. 

Sample Requirements

Sample amounts are listed for reference only. Download the Sample Submission Guidelines to learn more. For detailed information, please contact us with your customized requests.

Sample typeVolumeNotes
Human Plasma/Serum≥50 μL• Please include enough dry ice and send by frozen delivery to avoid sample thawing during shipping.
• It is recommended to store samples at −80 °C immediately after extraction as hemolysis may affect the analysis results 
Other sample matricesExamples – CSF, lysates, cell culture supernatant, etc.
Please contact us for more information. 

Sample Requirements

Sample amounts are listed for reference only. Download the Sample Submission Guidelines to learn more. For detailed information, please contact us with your customized requests.

Sample typeVolumeNotes
Human Plasma/Serum≥50 μL• Please include enough dry ice and send by frozen delivery to avoid sample thawing during shipping.
• It is recommended to store samples at −80 °C immediately after extraction as hemolysis may affect the analysis results 
Other sample matricesExamples – CSF, lysates, cell culture supernatant, etc.
Please contact us for more information. 

Workflow

Workflow

Workflow

Workflow

Workflow

Workflow

Workflow

Workflow

Specifications

Sample Requirements

Sample amounts are listed for reference only. Download the Sample Submission Guidelines to learn more. For detailed information, please contact us with your customized requests.

Sample typeVolumeNotes
Human Plasma/Serum≥50 μL• Please include enough dry ice and send by frozen delivery to avoid sample thawing during shipping.
• It is recommended to store samples at −80 °C immediately after extraction as hemolysis may affect the analysis results 
Other sample matricesExamples – CSF, lysates, cell culture supernatant, etc.
Please contact us for more information. 

Sample Requirements

Sample amounts are listed for reference only. Download the Sample Submission Guidelines to learn more. For detailed information, please contact us with your customized requests.

Sample typeVolumeNotes
Human Plasma/Serum≥50 μL• Please include enough dry ice and send by frozen delivery to avoid sample thawing during shipping.
• It is recommended to store samples at −80 °C immediately after extraction as hemolysis may affect the analysis results 
Other sample matricesExamples – CSF, lysates, cell culture supernatant, etc.
Please contact us for more information. 

Sample Requirements

Sample amounts are listed for reference only. Download the Sample Submission Guidelines to learn more. For detailed information, please contact us with your customized requests.

Sample typeVolumeNotes
Human Plasma/Serum≥50 μL• Please include enough dry ice and send by frozen delivery to avoid sample thawing during shipping.
• It is recommended to store samples at −80 °C immediately after extraction as hemolysis may affect the analysis results 
Other sample matricesExamples – CSF, lysates, cell culture supernatant, etc.
Please contact us for more information. 

Sample Requirements

Sample amounts are listed for reference only. Download the Sample Submission Guidelines to learn more. For detailed information, please contact us with your customized requests.

Sample typeVolumeNotes
Human Plasma/Serum≥50 μL• Please include enough dry ice and send by frozen delivery to avoid sample thawing during shipping.
• It is recommended to store samples at −80 °C immediately after extraction as hemolysis may affect the analysis results 
Other sample matricesExamples – CSF, lysates, cell culture supernatant, etc.
Please contact us for more information. 

Workflow

Workflow

Workflow

Workflow

Workflow

Workflow

Workflow

Workflow

Resources

Proximity Extension Assay

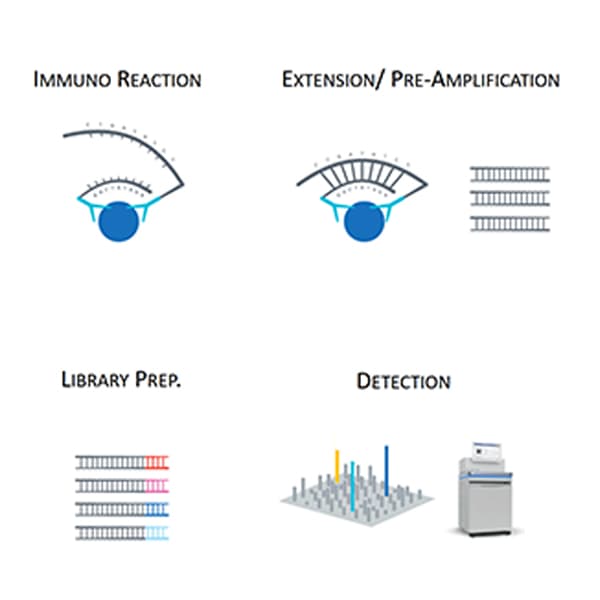
1. Immuno reaction: Two matched antibodies labelled with unique DNA oligonucleotides simultaneously bind to a target protein in solution.

2. Extension: In close proximity, their DNA oligos hybridize and are extended by DNA polymerase, resulting in a DNA barcode unique for each protein.

3. Detection: This newly created DNA barcode is amplified by PCR and ready for readout by NGS

Preview

1. Immuno reaction: Two matched antibodies labelled with unique DNA oligonucleotides simultaneously bind to a target protein in solution.

2. Extension: In close proximity, their DNA oligos hybridize and are extended by DNA polymerase, resulting in a DNA barcode unique for each protein.

3. Detection: This newly created DNA barcode is amplified by PCR and ready for readout by NGS

Preview

1. Immuno reaction: Two matched antibodies labelled with unique DNA oligonucleotides simultaneously bind to a target protein in solution.

2. Extension: In close proximity, their DNA oligos hybridize and are extended by DNA polymerase, resulting in a DNA barcode unique for each protein.

3. Detection: This newly created DNA barcode is amplified by PCR and ready for readout by NGS

Preview

1. Immuno reaction: Two matched antibodies labelled with unique DNA oligonucleotides simultaneously bind to a target protein in solution.

2. Extension: In close proximity, their DNA oligos hybridize and are extended by DNA polymerase, resulting in a DNA barcode unique for each protein.

3. Detection: This newly created DNA barcode is amplified by PCR and ready for readout by NGS

Preview

Biomarker list for Olink Reveal

Biomarker list for Olink Reveal
(Biomarker list for Olink Reveal)
Biomarker list for Olink Reveal
(Biomarker list for Olink Reveal)
Biomarker list for Olink Reveal
(Biomarker list for Olink Reveal)
Biomarker list for Olink Reveal
(Biomarker list for Olink Reveal)

Demo Results

Image
Image
1/1
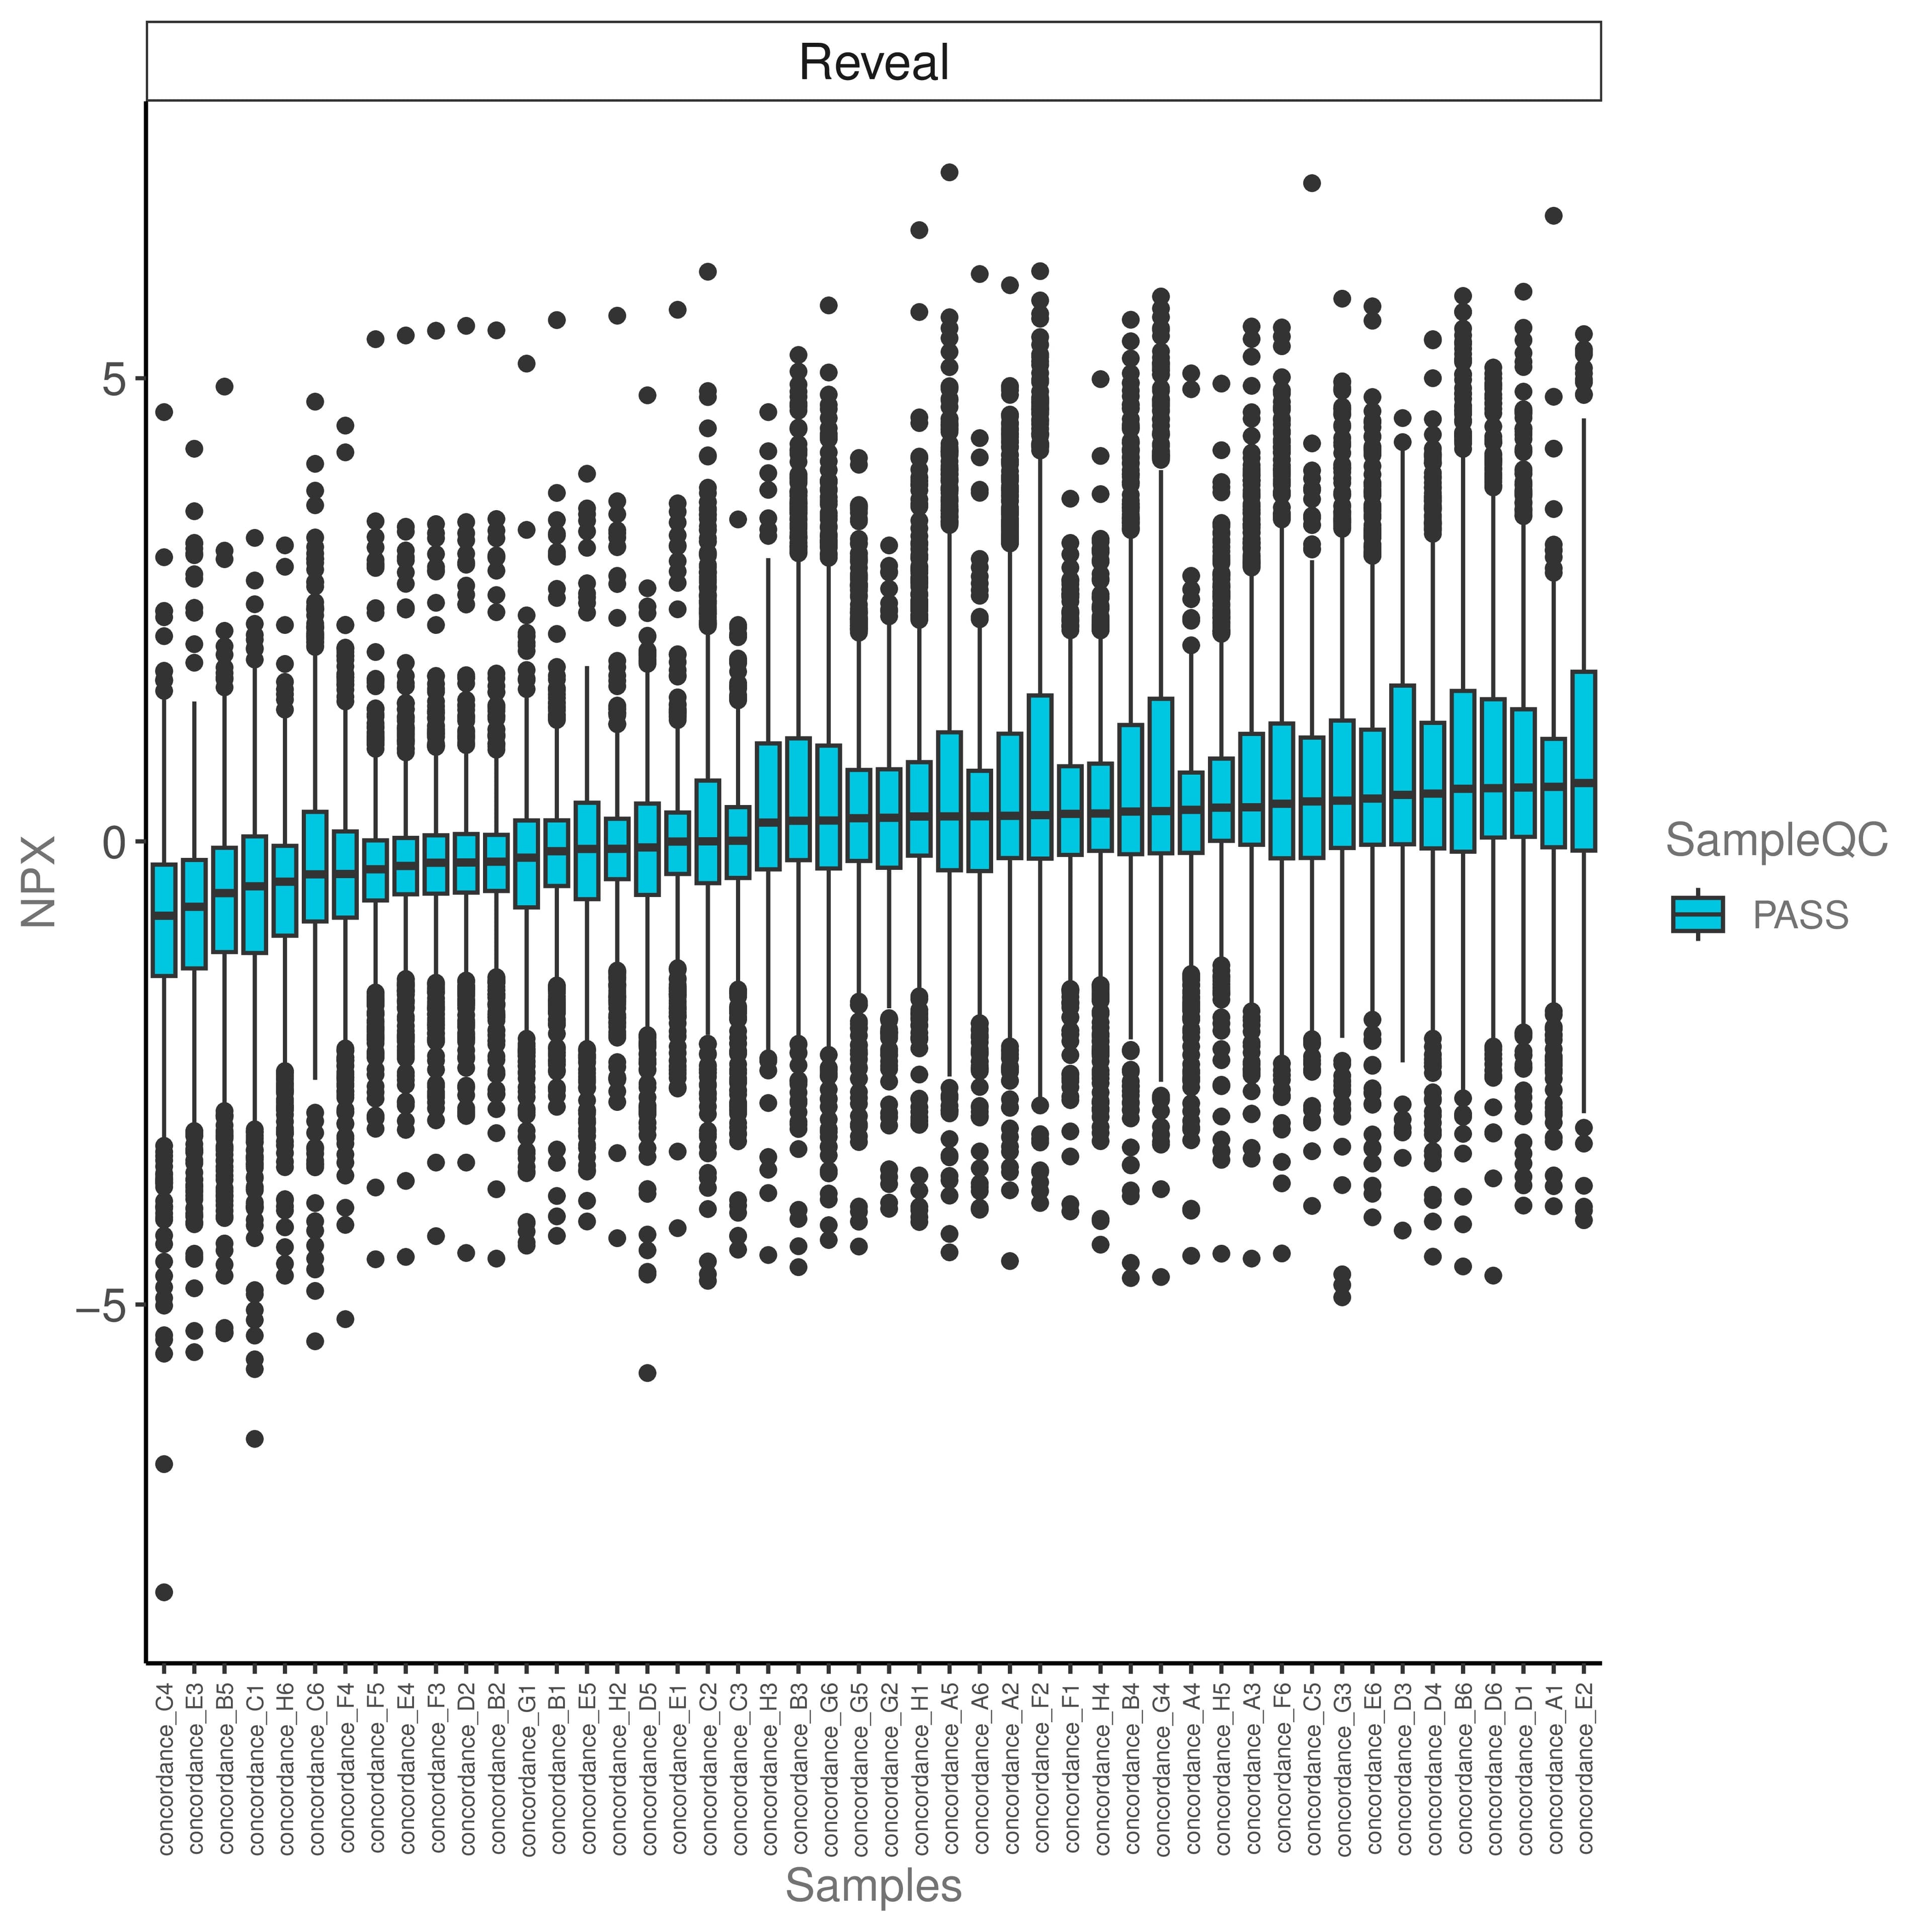
Data Normalization and Quality Control

Following sequencing, raw counts per assay-sample combination are converted into NPX (Normalized Protein eXpression) values, Olink's arbitrary log2-scale unit, for protein expression analysis.

Image
Image
1/1
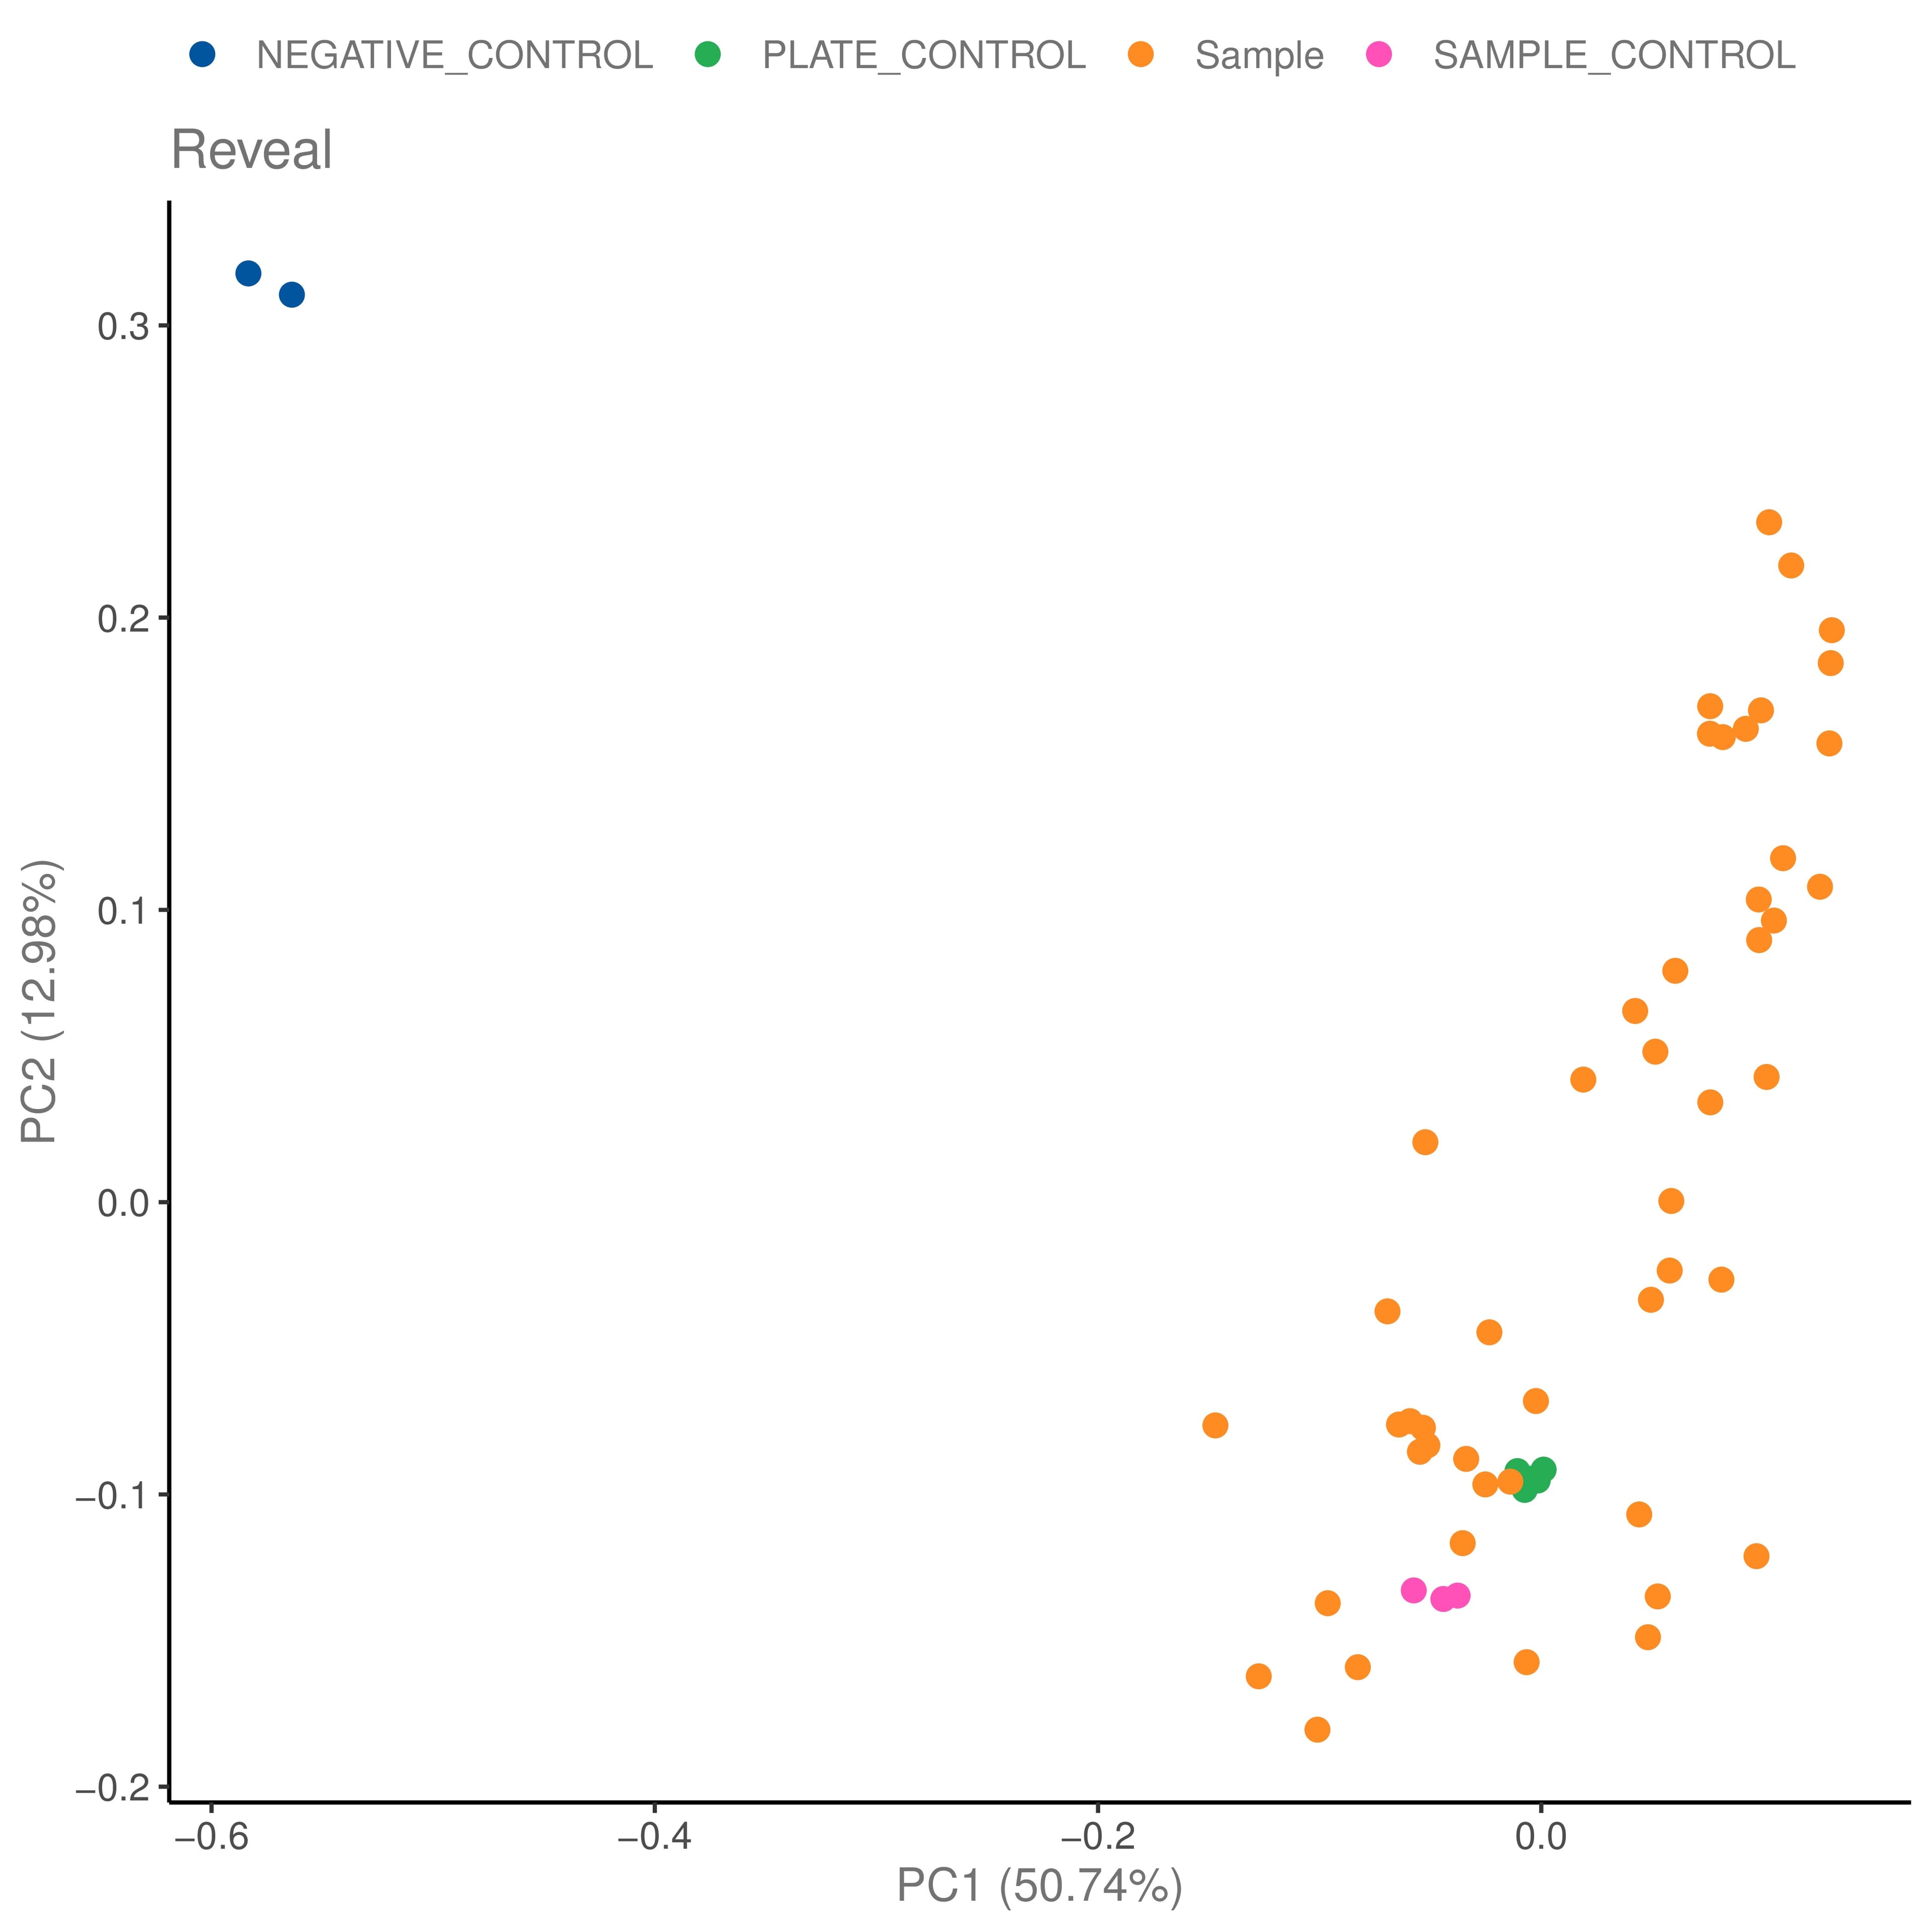
Protein Expression Analysis

PCA plot, Pearson's correlation coefficient analysis, and heatmaps are used to visualize protein expression profiles for all samples.

Image
Image
1/1
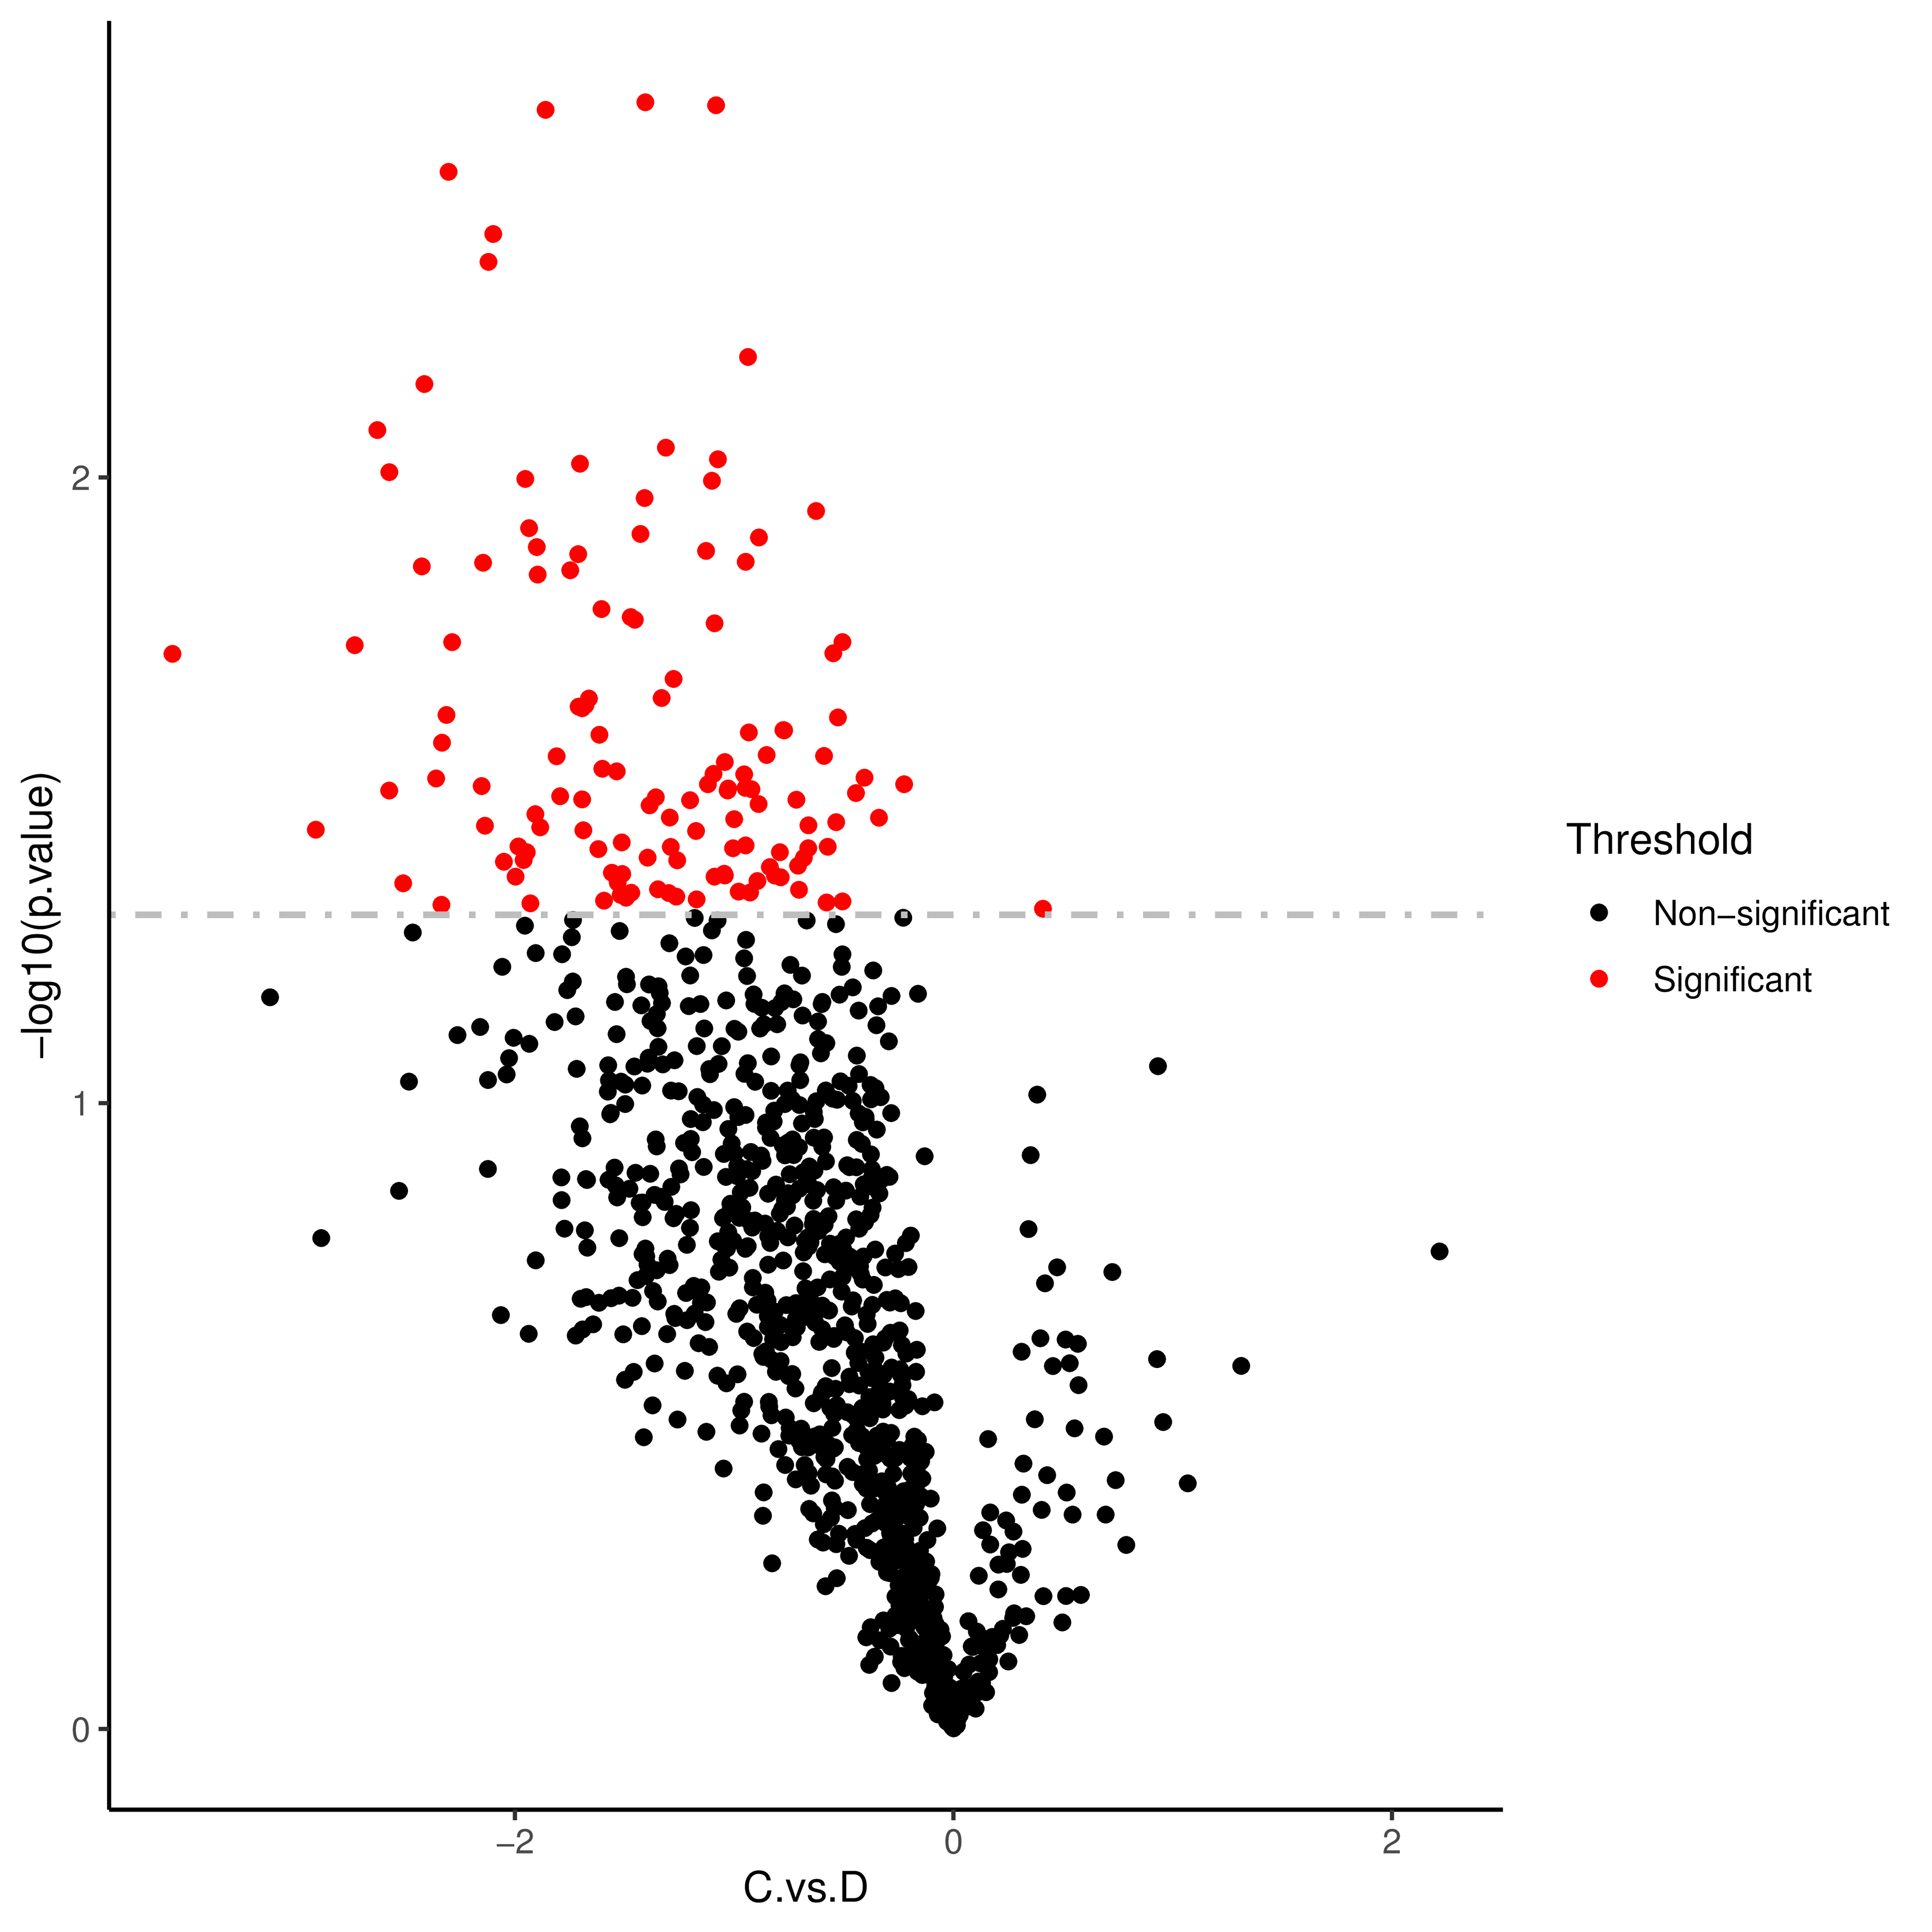
Differentially Expressed Proteins (DEPs) Analysis

Identified DEPs are visualized through volcano plots and heatmaps. Correlation patterns are explored via network diagrams and scatter plots, and DEP importance is evaluated using random forest analysis and ROC curves.

Image
Image
1/1
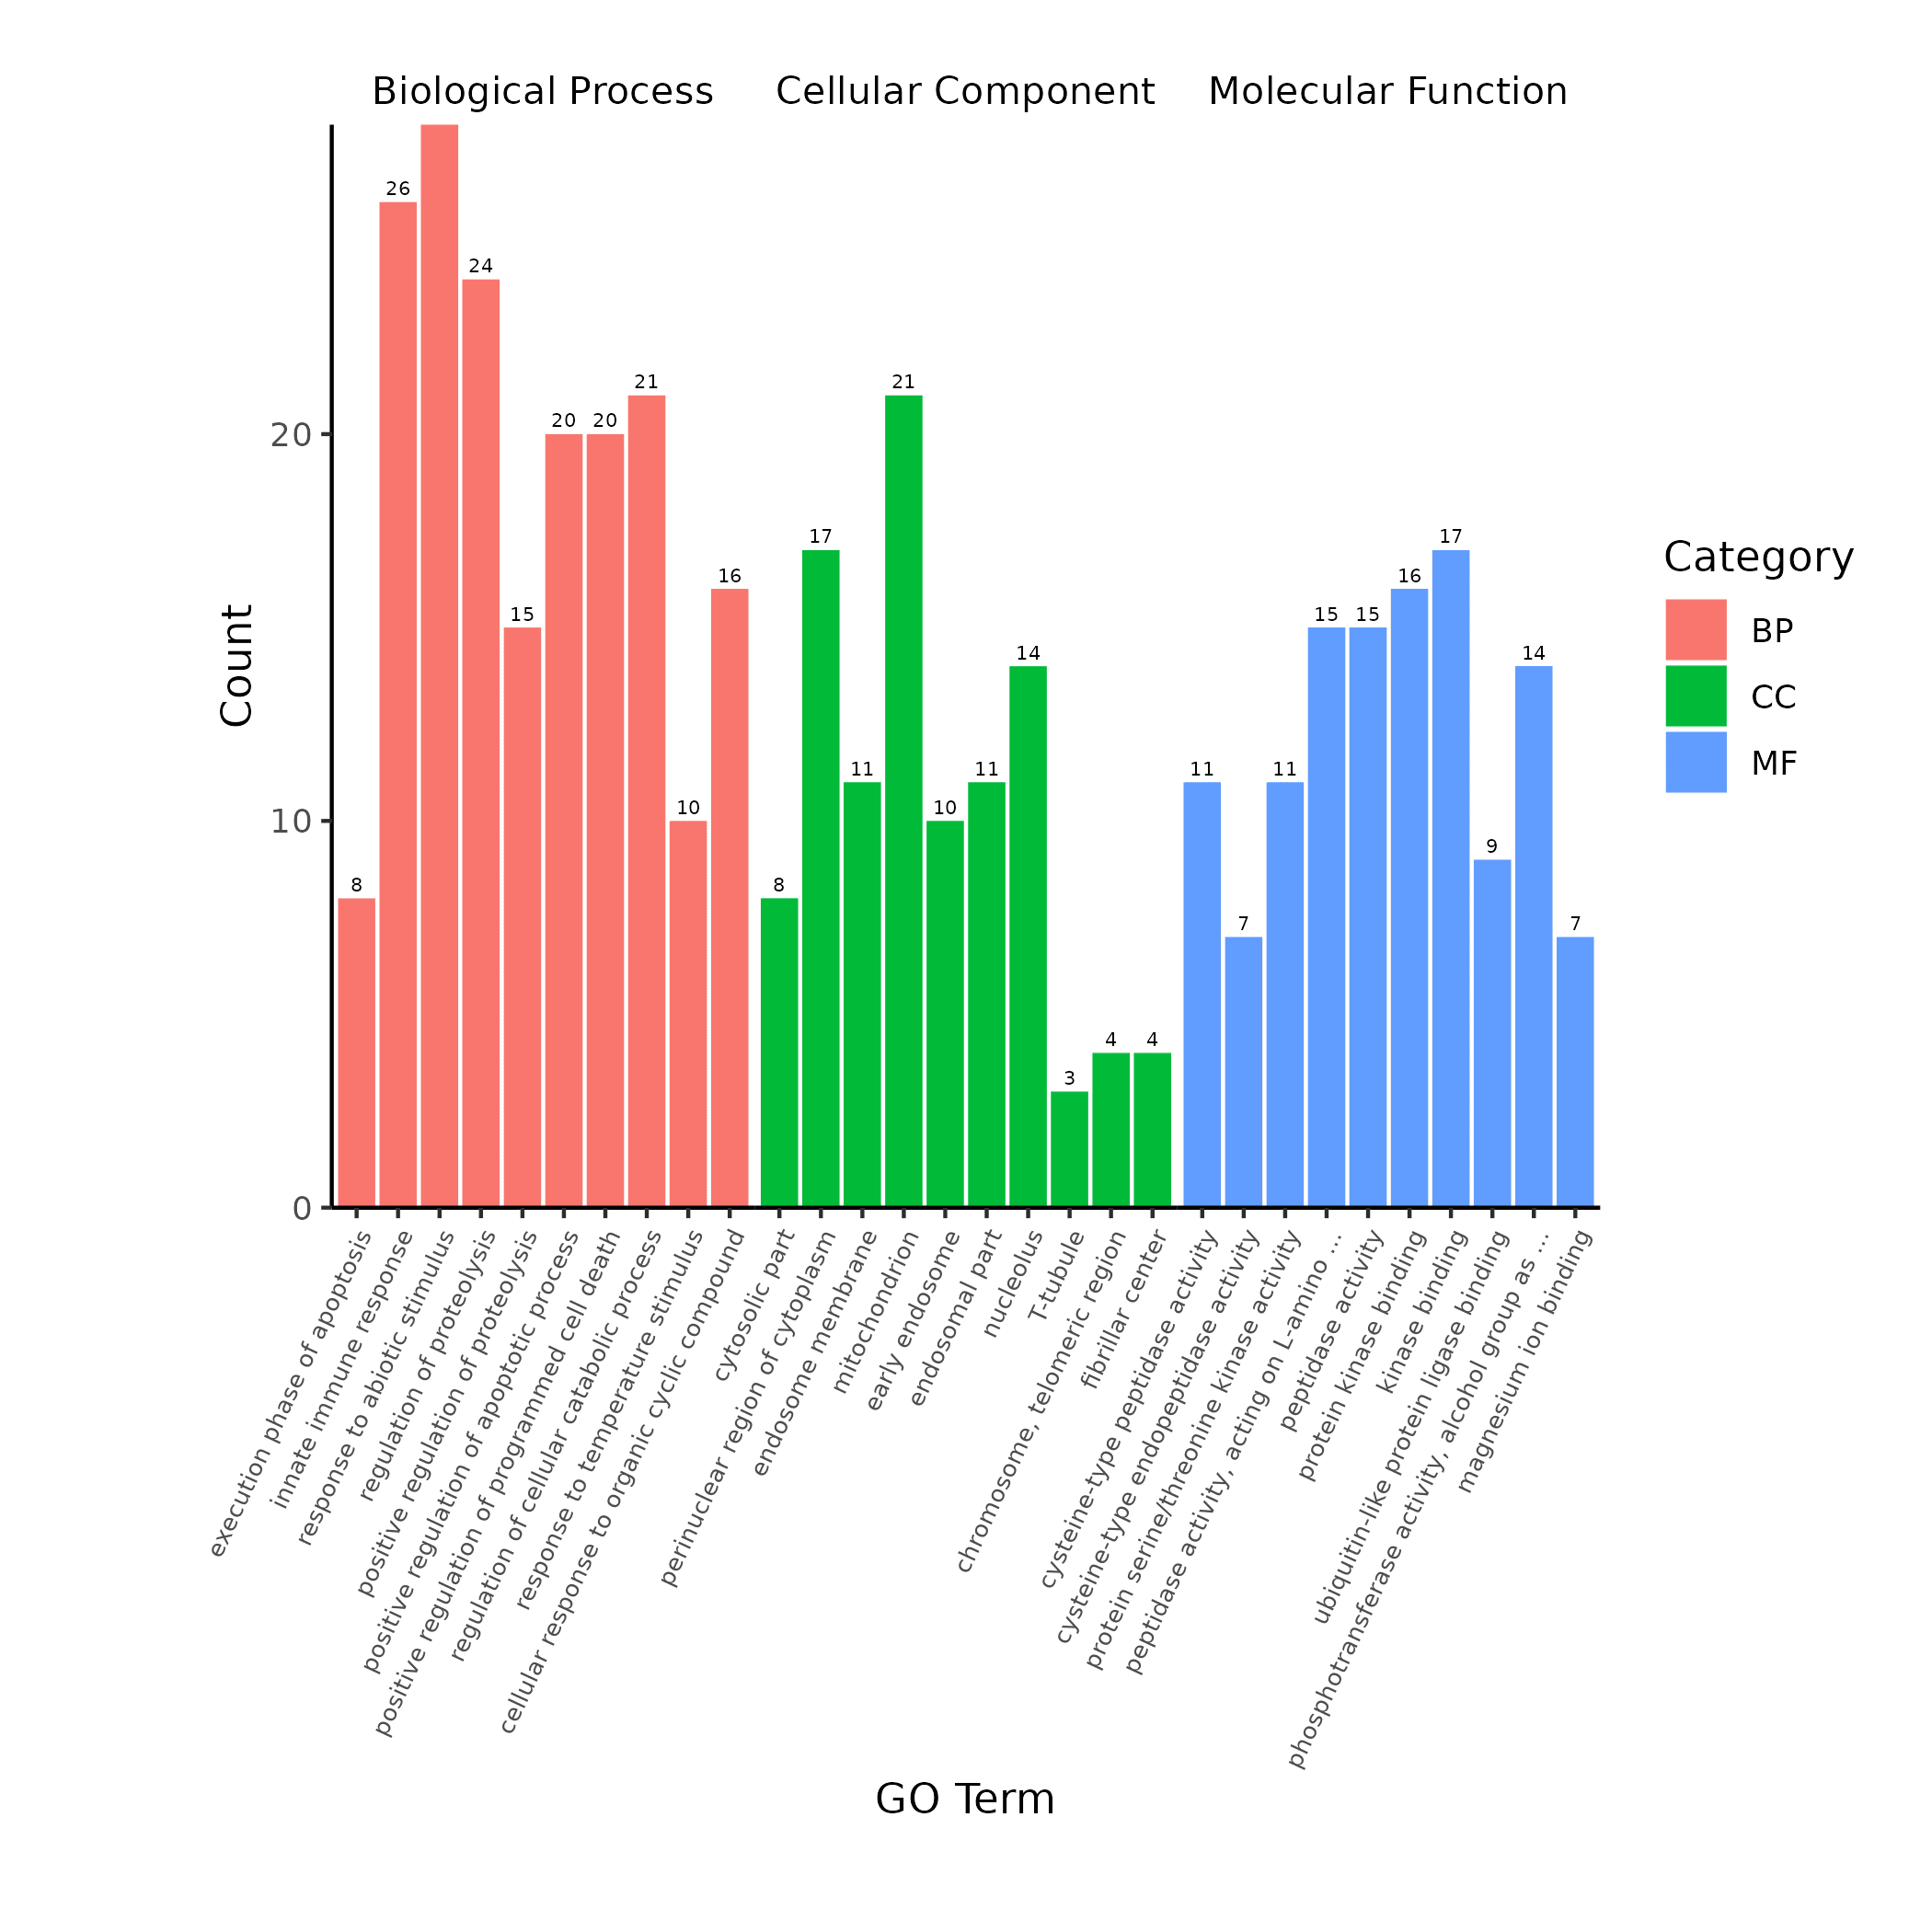
Functional Analysis

Multiple enrichment analyses (GO, KEGG, Reactome, DO, and InterPro) are performed to identify associated biological functions and pathways. PPI networks visualize protein interactions.

Image
Image
1/1
Data Normalization and Quality Control

Following sequencing, raw counts per assay-sample combination are converted into NPX (Normalized Protein eXpression) values, Olink's arbitrary log2-scale unit, for protein expression analysis.

Image
Image
1/1
Protein Expression Analysis

PCA plot, Pearson's correlation coefficient analysis, and heatmaps are used to visualize protein expression profiles for all samples.

Image
Image
1/1
Differentially Expressed Proteins (DEPs) Analysis

Identified DEPs are visualized through volcano plots and heatmaps. Correlation patterns are explored via network diagrams and scatter plots, and DEP importance is evaluated using random forest analysis and ROC curves.

Image
Image
1/1
Functional Analysis

Multiple enrichment analyses (GO, KEGG, Reactome, DO, and InterPro) are performed to identify associated biological functions and pathways. PPI networks visualize protein interactions.

Image
Image
1/1
Data Normalization and Quality Control

Following sequencing, raw counts per assay-sample combination are converted into NPX (Normalized Protein eXpression) values, Olink's arbitrary log2-scale unit, for protein expression analysis.

Image
Image
1/1
Protein Expression Analysis

PCA plot, Pearson's correlation coefficient analysis, and heatmaps are used to visualize protein expression profiles for all samples.

Image
Image
1/1
Differentially Expressed Proteins (DEPs) Analysis

Identified DEPs are visualized through volcano plots and heatmaps. Correlation patterns are explored via network diagrams and scatter plots, and DEP importance is evaluated using random forest analysis and ROC curves.

Image
Image
1/1
Functional Analysis

Multiple enrichment analyses (GO, KEGG, Reactome, DO, and InterPro) are performed to identify associated biological functions and pathways. PPI networks visualize protein interactions.

Image
Image
1/1
Data Normalization and Quality Control

Following sequencing, raw counts per assay-sample combination are converted into NPX (Normalized Protein eXpression) values, Olink's arbitrary log2-scale unit, for protein expression analysis.

Image
Image
1/1
Protein Expression Analysis

PCA plot, Pearson's correlation coefficient analysis, and heatmaps are used to visualize protein expression profiles for all samples.

Image
Image
1/1
Differentially Expressed Proteins (DEPs) Analysis

Identified DEPs are visualized through volcano plots and heatmaps. Correlation patterns are explored via network diagrams and scatter plots, and DEP importance is evaluated using random forest analysis and ROC curves.

Image
Image
1/1
Functional Analysis

Multiple enrichment analyses (GO, KEGG, Reactome, DO, and InterPro) are performed to identify associated biological functions and pathways. PPI networks visualize protein interactions.

Background
Background

Ready to Start Your Project?

Our platform offers tailored solutions for

your unique experimental needs, ensuring a seamless experience from project design to data delivery.


Your Privacy ChoicesPrivacy PolicyCookie PolicyCareers
banner laptop bg
banner mobile bg

Olink Proteomics

High-throughput, targeted protein profiling to quantify low-abundance biomarkers and reveal biological pathways associated with health and disease.
OverviewOverview
BenefitsBenefits
ApplicationsApplications
SpecificationsSpecifications
ResourcesResources

Olink Proteomics is a high-throughput proteomics solution for protein biomarker discovery in human body fluids--such as plasma, serum, cerebrospinal fluid, and urine--with exceptional efficiency. Olink Proteomics employ Proximity Extension Assay (PEA) technology to target thansands of proteins, which are subsequently quantified via Next-Genration Sequencing (NGS). By integrating the specificity of immunoassays with the scalability and precision of sequencing, Olink Proteomics delivers outstanding specificity, sensitivity, and scalability. This makes it an ideal tool for researchers investigating complex biological systems, disease mechanisms, and potential therapeutic targets through protein biomarker analysis.


We are among the first certified providers worldwide to offer high-throughput, high-quality protein biomarker discovery services using Olink’s leading proteomics platforms with Olink Reveal Panel

Why Choose Olink Proteomics

High Specificity

Dual-antibody PEA technology ensures precise target recognition by requiring simultaneous binding for detection.

High Specificity

Dual-antibody PEA technology ensures precise target recognition by requiring simultaneous binding for detection.

High Sensitivity and Wide Dynamic Range

10-log dynamic range (fg/mL to mg/mL) with full coverage of high, medium and low abundance proteins

High Sensitivity and Wide Dynamic Range

10-log dynamic range (fg/mL to mg/mL) with full coverage of high, medium and low abundance proteins

High Throughput

Screen up to 1000+ proteins per sample

High Throughput

Screen up to 1000+ proteins per sample

Low Sample Volume

as low as 2~4 uL for each sample matrix, ideal for precious biobank samples

Low Sample Volume

as low as 2~4 uL for each sample matrix, ideal for precious biobank samples

Why Choose Olink Proteomics

High Specificity

Dual-antibody PEA technology ensures precise target recognition by requiring simultaneous binding for detection.

High Specificity

Dual-antibody PEA technology ensures precise target recognition by requiring simultaneous binding for detection.

High Sensitivity and Wide Dynamic Range

10-log dynamic range (fg/mL to mg/mL) with full coverage of high, medium and low abundance proteins

High Sensitivity and Wide Dynamic Range

10-log dynamic range (fg/mL to mg/mL) with full coverage of high, medium and low abundance proteins

High Throughput

Screen up to 1000+ proteins per sample

High Throughput

Screen up to 1000+ proteins per sample

Low Sample Volume

as low as 2~4 uL for each sample matrix, ideal for precious biobank samples

Low Sample Volume

as low as 2~4 uL for each sample matrix, ideal for precious biobank samples

Why Choose Novogene for your Olink Proteomics?

Olink Certified Service ProviderOlink Certified Service Provider
Olink Certified Service Provider

Global CSP for Olink Reveal Proteomics

Olink Certified Service Provider

Global CSP for Olink Reveal Proteomics

Comprehensive AnalysisComprehensive Analysis
Comprehensive Analysis

Bioinformatic expertise supporting multiomics analysis and customized analysis

Comprehensive Analysis

Bioinformatic expertise supporting multiomics analysis and customized analysis

Outstanding Project Management Outstanding Project Management 
Outstanding Project Management 

Dedicated team supporting projects of any scale

Outstanding Project Management 

Dedicated team supporting projects of any scale

Why Choose Novogene for your Olink Proteomics?

Olink Certified Service ProviderOlink Certified Service Provider
Olink Certified Service Provider

Global CSP for Olink Reveal Proteomics

Olink Certified Service Provider

Global CSP for Olink Reveal Proteomics

Comprehensive AnalysisComprehensive Analysis
Comprehensive Analysis

Bioinformatic expertise supporting multiomics analysis and customized analysis

Comprehensive Analysis

Bioinformatic expertise supporting multiomics analysis and customized analysis

Outstanding Project Management Outstanding Project Management 
Outstanding Project Management 

Dedicated team supporting projects of any scale

Outstanding Project Management 

Dedicated team supporting projects of any scale

Applications of Olink Proteomics in Research and Medicine

Discover the power of Olink Proteomics with Novogene’s services, designed to assist in a variety of research goals:

Proteomic profiling

Screen disease-specific biomarkers; identify protein signatures for precision medicine or treatment response

Proteomic profiling

Screen disease-specific biomarkers; identify protein signatures for precision medicine or treatment response

Disease classification

Develop diagnostic and prognostic model by integrating proteomics with genomic and clinical data

Disease classification

Develop diagnostic and prognostic model by integrating proteomics with genomic and clinical data

Drug development

Identify drug targets and therapeutic biomarkers, gain insights into drug efficacy and mechanism-of-action

Drug development

Identify drug targets and therapeutic biomarkers, gain insights into drug efficacy and mechanism-of-action

Applications of Olink Proteomics in Research and Medicine

Discover the power of Olink Proteomics with Novogene’s services, designed to assist in a variety of research goals:

Proteomic profiling

Screen disease-specific biomarkers; identify protein signatures for precision medicine or treatment response

Proteomic profiling

Screen disease-specific biomarkers; identify protein signatures for precision medicine or treatment response

Disease classification

Develop diagnostic and prognostic model by integrating proteomics with genomic and clinical data

Disease classification

Develop diagnostic and prognostic model by integrating proteomics with genomic and clinical data

Drug development

Identify drug targets and therapeutic biomarkers, gain insights into drug efficacy and mechanism-of-action

Drug development

Identify drug targets and therapeutic biomarkers, gain insights into drug efficacy and mechanism-of-action

Specifications

Sample Requirements

Sample amounts are listed for reference only. Download the Sample Submission Guidelines to learn more. For detailed information, please contact us with your customized requests.

Sample typeVolumeNotes
Human Plasma/Serum≥50 μL• Please include enough dry ice and send by frozen delivery to avoid sample thawing during shipping.
• It is recommended to store samples at −80 °C immediately after extraction as hemolysis may affect the analysis results 
Other sample matricesExamples – CSF, lysates, cell culture supernatant, etc.
Please contact us for more information. 

Sample Requirements

Sample amounts are listed for reference only. Download the Sample Submission Guidelines to learn more. For detailed information, please contact us with your customized requests.

Sample typeVolumeNotes
Human Plasma/Serum≥50 μL• Please include enough dry ice and send by frozen delivery to avoid sample thawing during shipping.
• It is recommended to store samples at −80 °C immediately after extraction as hemolysis may affect the analysis results 
Other sample matricesExamples – CSF, lysates, cell culture supernatant, etc.
Please contact us for more information. 

Sample Requirements

Sample amounts are listed for reference only. Download the Sample Submission Guidelines to learn more. For detailed information, please contact us with your customized requests.

Sample typeVolumeNotes
Human Plasma/Serum≥50 μL• Please include enough dry ice and send by frozen delivery to avoid sample thawing during shipping.
• It is recommended to store samples at −80 °C immediately after extraction as hemolysis may affect the analysis results 
Other sample matricesExamples – CSF, lysates, cell culture supernatant, etc.
Please contact us for more information. 

Sample Requirements

Sample amounts are listed for reference only. Download the Sample Submission Guidelines to learn more. For detailed information, please contact us with your customized requests.

Sample typeVolumeNotes
Human Plasma/Serum≥50 μL• Please include enough dry ice and send by frozen delivery to avoid sample thawing during shipping.
• It is recommended to store samples at −80 °C immediately after extraction as hemolysis may affect the analysis results 
Other sample matricesExamples – CSF, lysates, cell culture supernatant, etc.
Please contact us for more information. 

Workflow

Workflow

Workflow

Workflow

Workflow

Workflow

Workflow

Workflow

Specifications

Sample Requirements

Sample amounts are listed for reference only. Download the Sample Submission Guidelines to learn more. For detailed information, please contact us with your customized requests.

Sample typeVolumeNotes
Human Plasma/Serum≥50 μL• Please include enough dry ice and send by frozen delivery to avoid sample thawing during shipping.
• It is recommended to store samples at −80 °C immediately after extraction as hemolysis may affect the analysis results 
Other sample matricesExamples – CSF, lysates, cell culture supernatant, etc.
Please contact us for more information. 

Sample Requirements

Sample amounts are listed for reference only. Download the Sample Submission Guidelines to learn more. For detailed information, please contact us with your customized requests.

Sample typeVolumeNotes
Human Plasma/Serum≥50 μL• Please include enough dry ice and send by frozen delivery to avoid sample thawing during shipping.
• It is recommended to store samples at −80 °C immediately after extraction as hemolysis may affect the analysis results 
Other sample matricesExamples – CSF, lysates, cell culture supernatant, etc.
Please contact us for more information. 

Sample Requirements

Sample amounts are listed for reference only. Download the Sample Submission Guidelines to learn more. For detailed information, please contact us with your customized requests.

Sample typeVolumeNotes
Human Plasma/Serum≥50 μL• Please include enough dry ice and send by frozen delivery to avoid sample thawing during shipping.
• It is recommended to store samples at −80 °C immediately after extraction as hemolysis may affect the analysis results 
Other sample matricesExamples – CSF, lysates, cell culture supernatant, etc.
Please contact us for more information. 

Sample Requirements

Sample amounts are listed for reference only. Download the Sample Submission Guidelines to learn more. For detailed information, please contact us with your customized requests.

Sample typeVolumeNotes
Human Plasma/Serum≥50 μL• Please include enough dry ice and send by frozen delivery to avoid sample thawing during shipping.
• It is recommended to store samples at −80 °C immediately after extraction as hemolysis may affect the analysis results 
Other sample matricesExamples – CSF, lysates, cell culture supernatant, etc.
Please contact us for more information. 

Workflow

Workflow

Workflow

Workflow

Workflow

Workflow

Workflow

Workflow

Resources

Proximity Extension Assay

1. Immuno reaction: Two matched antibodies labelled with unique DNA oligonucleotides simultaneously bind to a target protein in solution.

2. Extension: In close proximity, their DNA oligos hybridize and are extended by DNA polymerase, resulting in a DNA barcode unique for each protein.

3. Detection: This newly created DNA barcode is amplified by PCR and ready for readout by NGS

Preview

1. Immuno reaction: Two matched antibodies labelled with unique DNA oligonucleotides simultaneously bind to a target protein in solution.

2. Extension: In close proximity, their DNA oligos hybridize and are extended by DNA polymerase, resulting in a DNA barcode unique for each protein.

3. Detection: This newly created DNA barcode is amplified by PCR and ready for readout by NGS

Preview

1. Immuno reaction: Two matched antibodies labelled with unique DNA oligonucleotides simultaneously bind to a target protein in solution.

2. Extension: In close proximity, their DNA oligos hybridize and are extended by DNA polymerase, resulting in a DNA barcode unique for each protein.

3. Detection: This newly created DNA barcode is amplified by PCR and ready for readout by NGS

Preview

1. Immuno reaction: Two matched antibodies labelled with unique DNA oligonucleotides simultaneously bind to a target protein in solution.

2. Extension: In close proximity, their DNA oligos hybridize and are extended by DNA polymerase, resulting in a DNA barcode unique for each protein.

3. Detection: This newly created DNA barcode is amplified by PCR and ready for readout by NGS

Preview

Biomarker list for Olink Reveal

Biomarker list for Olink Reveal
(Biomarker list for Olink Reveal)
Biomarker list for Olink Reveal
(Biomarker list for Olink Reveal)
Biomarker list for Olink Reveal
(Biomarker list for Olink Reveal)
Biomarker list for Olink Reveal
(Biomarker list for Olink Reveal)

Demo Results

Image
Image
1/1
Data Normalization and Quality Control

Following sequencing, raw counts per assay-sample combination are converted into NPX (Normalized Protein eXpression) values, Olink's arbitrary log2-scale unit, for protein expression analysis.

Image
Image
1/1
Protein Expression Analysis

PCA plot, Pearson's correlation coefficient analysis, and heatmaps are used to visualize protein expression profiles for all samples.

Image
Image
1/1
Differentially Expressed Proteins (DEPs) Analysis

Identified DEPs are visualized through volcano plots and heatmaps. Correlation patterns are explored via network diagrams and scatter plots, and DEP importance is evaluated using random forest analysis and ROC curves.

Image
Image
1/1
Functional Analysis

Multiple enrichment analyses (GO, KEGG, Reactome, DO, and InterPro) are performed to identify associated biological functions and pathways. PPI networks visualize protein interactions.

Image
Image
1/1
Data Normalization and Quality Control

Following sequencing, raw counts per assay-sample combination are converted into NPX (Normalized Protein eXpression) values, Olink's arbitrary log2-scale unit, for protein expression analysis.

Image
Image
1/1
Protein Expression Analysis

PCA plot, Pearson's correlation coefficient analysis, and heatmaps are used to visualize protein expression profiles for all samples.

Image
Image
1/1
Differentially Expressed Proteins (DEPs) Analysis

Identified DEPs are visualized through volcano plots and heatmaps. Correlation patterns are explored via network diagrams and scatter plots, and DEP importance is evaluated using random forest analysis and ROC curves.

Image
Image
1/1
Functional Analysis

Multiple enrichment analyses (GO, KEGG, Reactome, DO, and InterPro) are performed to identify associated biological functions and pathways. PPI networks visualize protein interactions.

Image
Image
1/1
Data Normalization and Quality Control

Following sequencing, raw counts per assay-sample combination are converted into NPX (Normalized Protein eXpression) values, Olink's arbitrary log2-scale unit, for protein expression analysis.

Image
Image
1/1
Protein Expression Analysis

PCA plot, Pearson's correlation coefficient analysis, and heatmaps are used to visualize protein expression profiles for all samples.

Image
Image
1/1
Differentially Expressed Proteins (DEPs) Analysis

Identified DEPs are visualized through volcano plots and heatmaps. Correlation patterns are explored via network diagrams and scatter plots, and DEP importance is evaluated using random forest analysis and ROC curves.

Image
Image
1/1
Functional Analysis

Multiple enrichment analyses (GO, KEGG, Reactome, DO, and InterPro) are performed to identify associated biological functions and pathways. PPI networks visualize protein interactions.

Image
Image
1/1
Data Normalization and Quality Control

Following sequencing, raw counts per assay-sample combination are converted into NPX (Normalized Protein eXpression) values, Olink's arbitrary log2-scale unit, for protein expression analysis.

Image
Image
1/1
Protein Expression Analysis

PCA plot, Pearson's correlation coefficient analysis, and heatmaps are used to visualize protein expression profiles for all samples.

Image
Image
1/1
Differentially Expressed Proteins (DEPs) Analysis

Identified DEPs are visualized through volcano plots and heatmaps. Correlation patterns are explored via network diagrams and scatter plots, and DEP importance is evaluated using random forest analysis and ROC curves.

Image
Image
1/1
Functional Analysis

Multiple enrichment analyses (GO, KEGG, Reactome, DO, and InterPro) are performed to identify associated biological functions and pathways. PPI networks visualize protein interactions.

Background
Background

Ready to Start Your Project?

Our platform offers tailored solutions for

your unique experimental needs, ensuring a seamless experience from project design to data delivery.


Your Privacy ChoicesPrivacy PolicyCookie PolicyCareers